Why scaling a Kubernetes gRPC service might not balance traffic
Here’s a scenario that trips up a lot of people the first time they hit it: you have a gRPC service running behind a Kubernetes Service, traffic feels unbalanced, so you scale the Deployment from 2 replicas to 10. You check the new Pods — they’re healthy, they’re in the EndpointSlice, everything Kubernetes reports looks correct. And your traffic is still hitting one Pod.
This isn’t a Kubernetes bug, and it isn’t a gRPC bug either. It’s what happens when a connection-level load balancer meets a client that’s very good at reusing one connection. I built a small, reproducible lab to show exactly why, then fixed it two different ways — once in application code, once in infrastructure — so I could measure both instead of just describing them.
The full project is on GitHub: k8s-grpc-lab. This post walks through the interesting parts.
The setup
Nothing fancy: a tiny gRPC server that implements one RPC, Echo, and returns its own Pod name alongside the message it received.
service EchoService {
  rpc Echo(EchoRequest) returns (EchoResponse);
}

message EchoResponse {
  string message = 1;
  string pod_name = 2;
}
That pod_name field is the whole trick. It’s what lets a load-testing client tell which backend actually answered each request, which is how the rest of this post can show real, measured distributions instead of asking you to take my word for it.
The client opens one persistent grpc.ClientConn and fires a lot of requests through it — this is the normal, idiomatic way to write a gRPC client in Go. Dial once, reuse the connection, avoid paying a TCP + TLS handshake per request.
The broken behavior
Deploy 2 replicas, point the client at the ClusterIP Service, send traffic, then scale to 10 replicas mid-run:
$ kubectl scale deployment/grpc-server -n grpc-lab --replicas=10
deployment.apps/grpc-server scaled

$ kubectl get endpointslices -n grpc-lab -l kubernetes.io/service-name=grpc-server -o wide
NAME                ADDRESSTYPE   PORTS   ENDPOINTS                                       AGE
grpc-server-zjg6g   IPv4          50051   10.244.2.2,10.244.1.9,10.244.2.42 + 7 more...   91m
Ten ready Pod IPs, correctly reported. And the client, still running on its original connection:
elapsed=30s total=942235

grpc-server-786bfd97df-hzjft      942235
942,235 requests, one Pod, zero requests reaching the other nine. docs/results.md in the repo has the full run with every step captured, not just this excerpt.
Why this happens
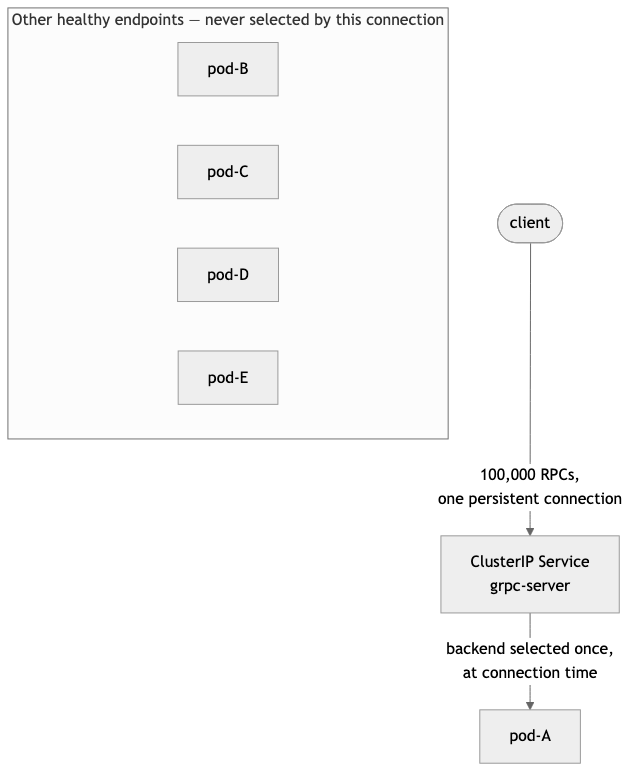
A Kubernetes Service doesn’t run a proxy that inspects every request. Depending on the dataplane — iptables, IPVS, eBPF, whatever your CNI uses — a backend gets picked when the connection is established, not on every request that flows through it afterward. Once your TCP connection is routed to a Pod, it stays routed there for the connection’s lifetime. Kubernetes has no reason to move it; from the dataplane’s point of view, it’s just bytes flowing over an already-established path.
Meanwhile, HTTP/2 — what gRPC runs on — multiplexes many independent requests over a single long-lived connection. Put the two together and you get:
100,000 RPCs → 1 gRPC channel → 1 HTTP/2 connection → 1 selected backend
Scaling the Deployment updates the EndpointSlice. It does nothing to a transport path that already exists. If the client never reconnects, it never sees the new replicas, no matter how many you add.
The tempting, wrong conclusion here is “Kubernetes doesn’t load balance gRPC well.” It balances exactly what it always balances — connections. gRPC is just very good at not needing many of them.
The fix: watch endpoints, balance client-side
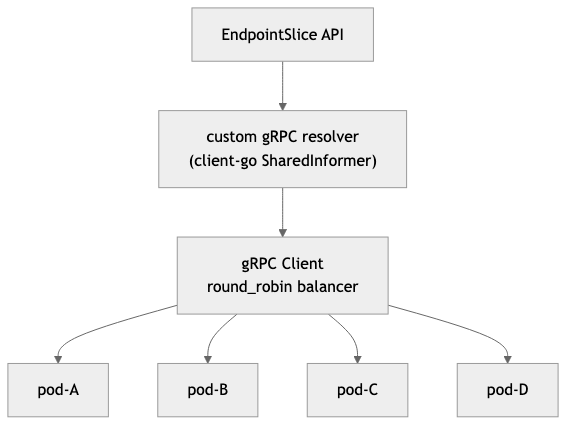
If the problem is that the client only has one connection to balance across, the fix is to give it more — driven by real endpoint data, not blind hope. I wrote a custom gRPC resolver that watches EndpointSlices directly via client-go, backed by a SharedInformer so it reacts to Pod adds/removes/readiness changes instead of polling:
lw := &cache.ListWatch{
    ListFunc: func(opts metav1.ListOptions) (runtime.Object, error) {
        return clientset.DiscoveryV1().EndpointSlices(namespace).List(ctx, opts)
    },
    WatchFunc: func(opts metav1.ListOptions) (watch.Interface, error) {
        return clientset.DiscoveryV1().EndpointSlices(namespace).Watch(ctx, opts)
    },
}
informer := cache.NewSharedInformer(lw, &discoveryv1.EndpointSlice{}, resyncPeriod)
Every time the address set changes, the resolver pushes an updated resolver.State to gRPC. Paired with the built-in round_robin balancing policy, gRPC opens one subchannel per Pod instead of one connection total:
grpc.NewClient(
    "k8s-endpointslice:///grpc-lab/grpc-server",
    grpc.WithResolvers(builder),
    grpc.WithDefaultServiceConfig(`{"loadBalancingConfig":[{"round_robin":{}}]}`),
)
Same 2 → 10 scale-up, same measurement method, different client:
====================================================
RESULT
====================================================

Basic client:

Active server Pods:        10
Pods receiving traffic:    1
Largest Pod share:        100%

Balanced client:

Active server Pods:        10
Pods receiving traffic:    10
Largest Pod share:        30%
====================================================
All ten Pods receiving traffic. The 30% “largest share” isn’t a balancing bug — some Pods were part of the connection pool since before the scale-up, so their cumulative count includes that earlier window. The eight Pods added by the scale-up land within a couple of percent of each other, which is the number that actually reflects round_robin’s behavior.
The resolver also handles scale-down correctly, dropping removed Pods without the client restarting, and the whole thing runs under a tightly-scoped RBAC Role — get/list/watch on endpointslices, nothing else.
Bonus round: what if I just use a service mesh?
This is the question I got the moment I showed this to people: doesn’t Istio (or Envoy, or Linkerd) already solve this? Yes — and I wanted to prove it rather than assert it, so the repo has a second, self-contained comparison.
The mechanism is different from the client-side fix, worth being precise about. With sidecar injection, an istio-proxy (Envoy) container intercepts all traffic in and out of the Pod. The application still opens exactly one connection — but now it terminates at the local sidecar, not at a Kubernetes-picked backend Pod. The sidecar understands HTTP/2 well enough to demultiplex individual RPC streams and dispatch each one, independently, across a connection pool it maintains to every ready backend sidecar:
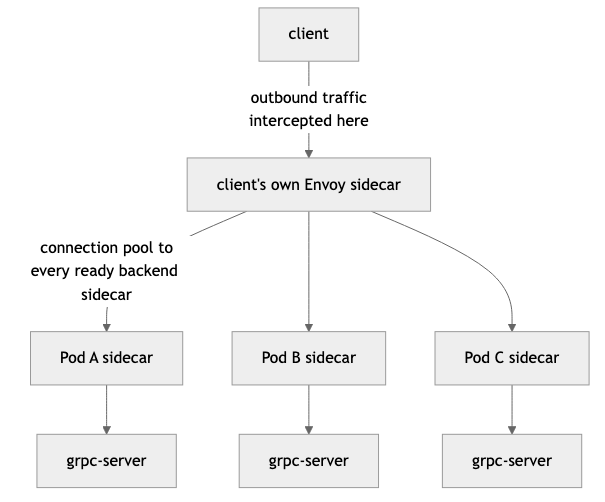
kube-proxy routes at the transport layer, once, per connection. Envoy routes at the application layer, per request, continuously. Same underlying fix as the custom resolver — more connections, driven by real endpoint data — just moved into infrastructure instead of application code.
The best part of building this as a real lab instead of a slide: I could deploy the exact same, unmodified broken client behind Istio sidecars — no code changes, no Kubernetes API awareness added to it — and watch it redistribute correctly anyway:
====================================================
RESULT
====================================================

No mesh (client-basic, plain ClusterIP):

Active server Pods:        10
Pods receiving traffic:    1
Largest Pod share:        100%

Istio mesh (same client-basic image, Envoy sidecars + STRICT mTLS):

Active server Pods:        10
Pods receiving traffic:    10
Largest Pod share:        40%
====================================================
I also didn’t want to just assert that mTLS was on — I set PeerAuthentication to STRICT and then proved it by pointing an unmeshed Pod at the same backend:
Total requests: 5
Successful:     0
Failed:         5
Zero out of five. STRICT mode isn’t a hint that degrades gracefully — an unmeshed workload genuinely cannot reach a meshed one.
Neither fix is universally “better.” A service mesh is the right call when you want this solved for every service uniformly, plus mTLS and workload identity as a standard platform property, and you’re willing to own a control plane. A client-side resolver is the right call for one or a few services where you want the mechanism explicit and don’t want a cluster-wide dependency. docs/service-mesh.md in the repo has the full three-way comparison and the reasoning behind picking one over the other.
Try it yourself
Everything above is real, measured output from a local kind cluster — nothing hardcoded, nothing simulated. Clone the repo and reproduce it:
git clone https://github.com/tiagomelo/k8s-grpc-lab
cd k8s-grpc-lab

make demo         # broken client vs. client-side fix
make demo-mesh    # broken client vs. the same client behind Istio
Both commands stand up their own kind cluster, deploy everything needed, run the comparison, and print a computed RESULT block — the numbers above came straight out of these commands, not out of a spreadsheet.
Conclusion
“Kubernetes can’t load balance gRPC” is a myth that survives because the failure mode is so easy to reproduce and so confusing the first time you see it. What’s actually happening is narrower and more interesting: a Service balances connections, gRPC is efficient specifically because it minimizes how many connections it opens, and those two design decisions collide the moment you scale.
Once you see it as a connection-count problem rather than a Kubernetes limitation, the fix stops being mysterious — you just need more connections, driven by real endpoint data, wherever you’re willing to put that logic: your client, or your infrastructure. I now have a lab that proves both work, with real numbers to back it up instead of hand-waving in a design doc.