Golang: out-of-box backpressure handling with gRPC, proven by a Grafana dashboard
I’ve been writing a lot about Go and gRPC lately:
- Golang: building a CRUD API using GRPC and MongoDB + handling arbitrary data types
- Golang: a dockerized gRPC server example
- Golang: a dockerized gRPC service using TLS
This time, I want to talk about a very useful and interesting rpc type: server-streaming rpc.
per grpc.io,
A server-streaming RPC is similar to a unary RPC, except that the server returns a stream of messages in response to a client’s request. After sending all its messages, the server’s status details (status code and optional status message) and optional trailing metadata are sent to the client. This completes processing on the server side. The client completes once it has all the server’s messages.
The link to the complete source code is available at the end of this article.
Use cases
Server-streaming RPC can be beneficial in specific scenarios over other communication methods:
Real-time Updates: If your server has a series of data that gets generated over time and you want to send those as soon as they’re ready, server-streaming can be quite useful. Examples include sending real-time stock prices, logs, or notifications.
Efficient Network Usage: Instead of the client frequently polling the server for updates, server-streaming provides an open channel to push updates, reducing unnecessary network traffic.
Backpressure Handling: gRPC and the underlying HTTP/2 protocol handle flow control. This means the server can only send data as fast as the client can consume, preventing overwhelming the client.
Efficient Computation: Some operations require a series of data to be sent based on a single request, without needing further requests from the client. For instance, if a client requests data transformation of a large dataset, the server can start sending transformed data pieces one by one instead of waiting to transform the entire set.
Avoiding Timeouts for Long Operations: Instead of having the client wait for a long computation to finish and risking timeouts, the server can periodically send updates or chunks of data.
Streaming Large Data Sets: For operations that return massive amounts of data, breaking it into smaller messages and streaming can be more memory-efficient than collecting and sending it all at once.
Stateful Interactions: In some scenarios, it’s useful for the server to maintain some state between messages (though this isn’t as stateful as bidirectional streaming). An example might be a server that sends tutorial steps to a client, adjusting the next step based on the client’s progression.
Synchronized Multimedia Streaming: If you’re transmitting synchronized multimedia data, where frames or pieces of information need to be sent in a specific order without waiting for a full collection, server-streaming can be a good choice.
In this article, we’ll see a practical example of backpressure handling.
What is backpressure?
Back pressure is a term used in various fields, including fluid dynamics and telecommunications, to describe resistance or force opposing the desired flow of a fluid or data. In the context of software engineering and system design, back pressure refers to a mechanism that allows a system to gracefully handle input rates that might exceed its processing capacity.
Example: stock prices updates
Imagine a stock market server that continuously tracks stock prices and sends updates to connected clients. Some clients might process and render these updates slower than others due to various reasons like system capabilities, user-defined settings, or even network constraints.
Without back pressure, if the server sends updates without restraint, clients that can’t keep up might face resource exhaustion, potentially leading to system crashes or unhandled data.
This seems a perfect use case for Server-Streaming RPC.
gRPC, built on HTTP/2, inherently supports flow control. The server can push updates, but it must also respect flow control signals from the client, ensuring that it doesn’t send data faster than what the client can handle.
We’ll write a gRPC server that sends stock updates and a client that requests stock updates and receives the stream of stock updates.
Regarding that client, we’ll explore two different scenarios:
- Client process the stock update (in our case, we’ll just log it to the console) as soon as it receives it from the server;
- Client randomly sleeps (to simulate some processing time) before processing the stock update from the server.
What we expected to see is that for the first case, the number of stock updates sent by the server will be almost equal to the number of processed updates by the client, meaning that no backpressure is needed. And for the second case, we expect the server to send less messages to the client, to avoid client’s exhaustion, so probably the number of processed messages by the client will be almost the half of the number of updates sent by the server.
To help us visualize these scenarios, we’ll build a Grafana Dashboard so we can follow along.
Protofile
api/proto/stockservice.go
// Copyright (c) 2023 Tiago Melo. All rights reserved.
// Use of this source code is governed by the MIT License that can be found in
// the LICENSE file.
syntax = "proto3";

package stockservice;

option go_package = "github.com/tiagomelo/golang-grpc-backpressure/api/proto/gen/stockservice";

// Service definition
service StockService {
    // Server-streaming RPC for sending stock updates to clients.
    rpc GetUpdates(EmptyRequest) returns (stream StockUpdate);
}

// Empty message sent by the client to request stock updates.
message EmptyRequest {}

// Message containing detailed stock update information.
message StockUpdate {
    string ticker = 1;       // Stock ticker symbol, e.g., "AAPL" for Apple Inc.
    double price = 2;        // Current stock price.
    double change = 3;       // Price change since the last update.
    double changePercent = 4; // Price change percentage since the last update.
    int64 volume = 5;        // Trading volume for the current day.
    double openPrice = 6;    // Opening price for the current trading session.
    double highPrice = 7;    // Highest price reached during the current trading session.
    double lowPrice = 8;     // Lowest price reached during the current trading session.
    int64 marketCap = 9;     // Market capitalization.
    string timestamp = 10;   // Timestamp of the update, e.g., "2023-08-16T15:04:05Z".
}
Notice the stream keyword before the return type StockUpdate: it indicates that this is a server-streaming rpc, where the server sends a stream of StockUpdate messages to the client.
When we compile it, one of the files that will be generated is api/proto/gen/stockservice_grpc.pb.go, which contains this struct:
// StockServiceServer is the server API for StockService service.
// All implementations must embed UnimplementedStockServiceServer
// for forward compatibility
type StockServiceServer interface {
    // Server-streaming RPC for sending stock updates to clients.
    GetUpdates(*EmptyRequest, StockService_GetUpdatesServer) error
    mustEmbedUnimplementedStockServiceServer()
}
Which means that GetUpdates(*EmptyRequest, StockService_GetUpdatesServer) error is the function that our gRPC server needs to implement, and mustEmbedUnimplementedStockServiceServer() means that the gRPC server also needs to embed UnimplementedStockServiceServer defined in that generated file for compatibility concerns.
Random stock update generator
stock/stock.go
// Copyright (c) 2023 Tiago Melo. All rights reserved.
// Use of this source code is governed by the MIT License that can be found in
// the LICENSE file.
package stock

import (
    "math/rand"
    "time"

    "github.com/tiagomelo/golang-grpc-backpressure/api/proto/gen/stockservice"
)

const (
    initialPrice          = 150.0
    priceFluctuationRange = 5.0
)

// stock represents a simple stock model.
type stock struct {
    ticker        string  // The stock's ticker symbol.
    currentPrice  float64 // The stock's current price.
    previousPrice float64 // The stock's price before the last update.
}

// New initializes and returns a new stock instance.
func New(ticker string, startingPrice float64) *stock {
    return &stock{
        ticker:        ticker,
        currentPrice:  startingPrice,
        previousPrice: startingPrice,
    }
}

// RandomUpdate generates a random stock update based on the stock's current price.
func (s *stock) RandomUpdate() *stockservice.StockUpdate {
    change := (rand.Float64() * priceFluctuationRange) - (priceFluctuationRange / 2)
    s.previousPrice = s.currentPrice
    s.currentPrice += change
    update := &stockservice.StockUpdate{
        Ticker:        s.ticker,
        Price:         s.currentPrice,
        Change:        change,
        ChangePercent: (change / s.previousPrice) * 100,
        Volume:        int64(rand.Intn(10000)),
        OpenPrice:     initialPrice,
        HighPrice:     s.currentPrice + rand.Float64()*2,
        LowPrice:      s.currentPrice - rand.Float64()*2,
        MarketCap:     int64(s.currentPrice * float64(rand.Intn(1000000))),
        Timestamp:     time.Now().Format(time.RFC3339),
    }
    return update
}
It will be called by our gRPC server to simulate stock updates to be sent to the clients.
gRPC Server
server/server.go
// Copyright (c) 2023 Tiago Melo. All rights reserved.
// Use of this source code is governed by the MIT License that can be found in
// the LICENSE file.
package server

import (
    "time"

    "github.com/prometheus/client_golang/prometheus"
    "github.com/prometheus/client_golang/prometheus/promauto"
    "github.com/tiagomelo/golang-grpc-backpressure/api/proto/gen/stockservice"
    "github.com/tiagomelo/golang-grpc-backpressure/stock"
    "google.golang.org/grpc"
    "google.golang.org/grpc/codes"
    "google.golang.org/grpc/reflection"
    "google.golang.org/grpc/status"
)

// sentUpdatesCounter is a Prometheus metric to keep track of the number of sent stock updates.
var sentUpdatesCounter = promauto.NewCounter(prometheus.CounterOpts{
    Name: "stock_updates_sent_total",
    Help: "The total number of stock updates sent by the server",
})

// server struct holds the gRPC server instance and implements the StockServiceServer interface.
type server struct {
    stockservice.UnimplementedStockServiceServer
    GrpcSrv      *grpc.Server
    initialDelay int
}

// New initializes and returns a new gRPC server with the StockService registered.
func New(initialDelay int) *server {
    grpcServer := grpc.NewServer()
    srv := &server{
        GrpcSrv:      grpcServer,
        initialDelay: initialDelay,
    }

    // Register the StockService with the gRPC server instance.
    stockservice.RegisterStockServiceServer(grpcServer, srv)

    // Register reflection service on gRPC server, useful for tools like `grpcurl`.
    reflection.Register(grpcServer)
    return srv
}

// GetUpdates streams stock updates to the client. It creates a stock with a starting price and sends
// random updates to the connected client every second.
func (s *server) GetUpdates(_ *stockservice.EmptyRequest, stream stockservice.StockService_GetUpdatesServer) error {
    const (
        ticker        = "AAPL"
        startingPrice = 150.0
    )
    stock := stock.New(ticker, startingPrice)
    time.Sleep(time.Duration(s.initialDelay) * time.Second)
    for {
        update := stock.RandomUpdate()
        if err := stream.Send(update); err != nil {
            return status.Error(codes.Unknown, "failed to send update to client: "+err.Error())
        }
        sentUpdatesCounter.Inc()
        time.Sleep(100 * time.Second)
    }
}
- sentUpdatesCounter is the Prometheus metric that we’ll use to keep track of the number of sent updates. It will be used by the dashboard we’ll build.
- GetUpdates will sleep a bit before sending updates so we have time to launch a client right after we launch the server. Then, it randomly generates a stock update at every second and streaming it to all connected cliens by calling stream.Send(update).
gRPC Client
client/client.go
// Copyright (c) 2023 Tiago Melo. All rights reserved.
// Use of this source code is governed by the MIT License that can be found in
// the LICENSE file.
//
// Package main contains the client implementation for interacting with the server streaming gRPC stock service.
package main

import (
    "context"
    "fmt"
    "io"
    "log"
    "math/rand"
    "net/http"
    "os"
    "time"

    "github.com/jessevdk/go-flags"
    "github.com/pkg/errors"
    "github.com/prometheus/client_golang/prometheus"
    "github.com/prometheus/client_golang/prometheus/promauto"
    "github.com/prometheus/client_golang/prometheus/promhttp"
    "github.com/tiagomelo/golang-grpc-backpressure/api/proto/gen/stockservice"
    "github.com/tiagomelo/golang-grpc-backpressure/config"
    "google.golang.org/grpc"
    "google.golang.org/grpc/credentials/insecure"
)

// receivedUpdatesCounter is a Prometheus metric to keep track of the number of received stock updates.
var receivedUpdatesCounter = promauto.NewCounter(prometheus.CounterOpts{
    Name: "stock_updates_received_total",
    Help: "The total number of stock updates received by the client",
})

// options struct holds command line flags configurations.
type options struct {
    RandomProcessingTime bool `short:"r" description:"Enable random processing time"`
}

// processStockUpdate simulates the processing of a stock update.
// If randomProcessingTime is enabled, it sleeps for a random duration before logging the update.
func processStockUpdate(logger *log.Logger, update *stockservice.StockUpdate, randomProcessingTime bool) {
    if randomProcessingTime {
        const (
            sleepMin = 1
            sleepMax = 3
        )
        seed := time.Now().UnixNano()
        r := rand.New(rand.NewSource(seed))
        duration := time.Duration(r.Intn(sleepMax)+sleepMin) * time.Second
        time.Sleep(duration)
    }
    logger.Println(fmt.Sprintf(`ticker:"%s" price:%.2f change:%.2f changePercent:%.2f volume:%d openPrice:%.2f highPrice:%.2f lowPrice:%.2f marketCap:%d timestamp:"%s"`,
        update.Ticker,
        update.Price,
        update.Change,
        update.ChangePercent,
        update.Volume,
        update.OpenPrice,
        update.HighPrice,
        update.LowPrice,
        update.MarketCap,
        update.Timestamp,
    ))
}

// receiveStockUpdates establishes a stream with the stock service to receive stock updates.
// For each received update, it processes (and optionally sleeps for a random duration) and then logs the update.
func receiveStockUpdates(ctx context.Context, logger *log.Logger, client stockservice.StockServiceClient, randomProcessingTime bool) error {
    stream, err := client.GetUpdates(ctx, &stockservice.EmptyRequest{})
    if err != nil {
        return errors.Wrap(err, "opening stream")
    }
    for {
        update, err := stream.Recv()
        if err == io.EOF {
            break
        }
        if err != nil {
            return errors.Wrap(err, "receiving update")
        }
        processStockUpdate(logger, update, randomProcessingTime)
        receivedUpdatesCounter.Inc()
    }
    return nil
}

// metricsHandler returns an HTTP handler for Prometheus metrics.
func metricsHandler() http.Handler {
    return promhttp.Handler()
}

// metricsServer starts an HTTP server on a given port to expose Prometheus metrics.
func metricsServer(serverPort int) {
    port := fmt.Sprintf(":%d", serverPort)
    http.Handle("/metrics", metricsHandler())
    log.Fatal(http.ListenAndServe(port, nil))
}

func run(logger *log.Logger, randomProcessingTime bool) error {
    logger.Println("main: initializing gRPC client")
    defer logger.Println("main: Completed")
    cfg, err := config.Read()
    if err != nil {
        return errors.Wrap(err, "reading config")
    }
    ctx := context.Background()
    const stockServiceHost = "localhost:4444"
    conn, err := grpc.Dial(stockServiceHost, grpc.WithTransportCredentials(insecure.NewCredentials()))
    if err != nil {
        fmt.Println("Failed to dial server:", err)
        os.Exit(1)
    }
    defer conn.Close()
    go metricsServer(cfg.StockServiceClientMetricsServerPort)
    client := stockservice.NewStockServiceClient(conn)
    if err := receiveStockUpdates(ctx, logger, client, randomProcessingTime); err != nil {
        return errors.Wrap(err, "receiving stock updates")
    }
    return nil
}

func main() {
    var opts options
    flags.Parse(&opts)
    logger := log.New(os.Stdout, "STOCK SERVICE CLIENT : ", log.LstdFlags|log.Lmicroseconds|log.Lshortfile)
    if err := run(logger, opts.RandomProcessingTime); err != nil {
        fmt.Println(err)
        os.Exit(1)
    }
}
- receivedUpdatesCounter is the Prometheus metric to keep track of received updates sent by the server. It will also be used by the dashboard we’ll build. Notice that we launch an http server (metricsServer()) to expose it, so it can be exported to Grafana by a Prometheus datasource.
- it accepts a flag -r to signal whether the client should randomly sleep between 1 and 3 seconds before processing the message, simulating some load.
- it receives the update from the server by calling stream.Recv(), which is the server stream.
Prometheus and Grafana
As we saw, both the server and the client declare and increment a Prometheus counter metric.
The client launches the HTTP handler to expose the received updates counter in its own source code. For our server, we will launch it in cmd/main.go which we’ll see in a bit.
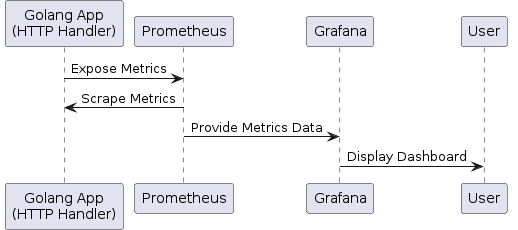
Those HTTP handlers expose those metrics in a format that’s understood by Prometheus. They act as an endpoint, which Prometheus is configured to periodically scrape and collect metrics data from. Once collected, Prometheus stores these metrics in its time-series database. Grafana, a visualization tool, is then set up to use Prometheus as its data source.
Here’s a sequence diagram that help us understand how it works:
docker-compose.yaml
version: '3.8'
services:
  grafana:
    image: grafana/grafana:latest
    container_name: bp-grafana
    env_file:
      - .env
    ports:
      - 3000:3000
    volumes:
      - grafana_data:/var/lib/grafana
      - ./obs/provisioning/dashboards:/etc/grafana/provisioning/dashboards
      - ./obs/provisioning/datasources:/etc/grafana/provisioning/datasources
    networks:
      - monitoring_network

  renderer:
    image: grafana/grafana-image-renderer:latest
    ports:
      - 8081
    networks:
      - monitoring_network

  prometheus:
    image: prom/prometheus:latest
    container_name: bp-prometheus
    volumes:
      - ./obs/prometheus/prometheus.yml:/etc/prometheus/prometheus.yml
      - prometheus_data:/prometheus
    command:
      - --config.file=/etc/prometheus/prometheus.yml
    ports:
      - 9090:9090
    networks:
      - monitoring_network

networks:
  monitoring_network:

volumes:
  grafana_data:
  prometheus_data:
Besides Prometheus and Grafana, we launch a Grafana Image Renderer, to be able to export a snapshot of the dashboard to an image. Reference: https://grafana.com/grafana/plugins/grafana-image-renderer/#run-in-docker
In almost every project where I implement observability, I strive to bootstrap everything that I need automatically, always. Which means to setup both Grafana and Prometheus via YAML files, so everytime Grafana is launched, I have it ready, even the dashboards for the application.
Under grafana service we have:
- ./obs/provisioning/dashboards:/etc/grafana/provisioning/dashboard
- ./obs/provisioning/datasources:/etc/grafana/provisioning/datasourcess
Here I’m copying both the dashboard and the Prometheus datasource to Grafana.
Under prometheus service we have:
- ./obs/prometheus/prometheus.yml:/etc/prometheus/prometheus.yml
Here I’m copying the Prometheus configuration YAML to Prometheus.
All these YAML files are fulfilled programmatically. As you can check in a previous article of mine, I’m using Go templating to help with it.
The templates
obs/templates/prometheus/prometheus.yaml
scrape_configs:
  - job_name: 'server'
    scrape_interval: 5s
    static_configs:
      - targets: ['{{.IP}}:{{.Port}}']
  - job_name: 'client'
    scrape_interval: 5s
    static_configs:
      - targets: ['{{.IP}}:{{.ClientPort}}']
Here we configure Prometheus to scrap metrics for both server and client, and the targets will be dinamically replaced with our machine’s IP and the port for the respective server and client HTTP metrics handler.
obs/templates/provisioning/datasources/datasource.yaml
apiVersion: 1

datasources:
- name: Prometheus
  type: prometheus
  url: http://{{.IP}}:{{.Port}}
  access: proxy
  isDefault: true
This is the template to configure Prometheus datasource in Grafana.
The template parser
templateparser/templateparser.go
// Copyright (c) 2023 Tiago Melo. All rights reserved.
// Use of this source code is governed by the MIT License that can be found in
// the LICENSE file.
//
// Package main contains a utility for generating configurations based on
// templates and specific data, e.g., IP addresses and ports.
package main

import (
    "fmt"
    "net"
    "os"
    "text/template"

    "github.com/pkg/errors"
    "github.com/tiagomelo/golang-grpc-backpressure/config"
)

// data is a struct that holds the information used to fill the templates.
type data struct {
    IP         string
    Port       int
    ClientPort int
}

// getOutboundIpAddr returns the outbound IP address of the current machine.
func getOutboundIpAddr() (string, error) {
    conn, err := net.Dial("udp", "8.8.8.8:80")
    if err != nil {
        return "", err
    }
    defer conn.Close()
    localAddr := conn.LocalAddr().(*net.UDPAddr)
    return localAddr.IP.String(), nil
}

// parseTemplate takes in a data object, a template file, and an output file.
// It parses the template, fills it with data, and writes the resulting configuration to the output file.
func parseTemplate(data *data, templateFile, outputFile string) error {
    tmpl, err := template.ParseFiles(templateFile)
    if err != nil {
        return errors.Wrapf(err, `parsing template file "%s"`, templateFile)
    }
    file, err := os.Create(outputFile)
    if err != nil {
        return errors.Wrapf(err, `creating output file "%s"`, outputFile)
    }
    defer file.Close()
    if err = tmpl.Execute(file, data); err != nil {
        return errors.Wrapf(err, `executing template file "%s"`, templateFile)
    }
    return nil
}

// parsePrometheusScrapeTemplate is a specialized function to generate Prometheus scrape configurations.
// It sets up data based on provided parameters and then uses the general template parsing function.
func parsePrometheusScrapeTemplate(ip string, serverPort, clientPort int, templateFile, outputFile string) error {
    data := &data{
        IP:         ip,
        Port:       serverPort,
        ClientPort: clientPort,
    }
    return parseTemplate(data, templateFile, outputFile)
}

// parsePrometheusDataSourceTemplate is another specialized function to generate Prometheus datasource configurations.
// It sets up data based on provided parameters and then uses the general template parsing function.
func parsePrometheusDataSourceTemplate(ip string, serverPort int, templateFile, outputFile string) error {
    data := &data{
        IP:   ip,
        Port: serverPort,
    }
    return parseTemplate(data, templateFile, outputFile)
}

func run() error {
    cfg, err := config.Read()
    if err != nil {
        return errors.Wrap(err, "reading config")
    }
    ip, err := getOutboundIpAddr()
    if err != nil {
        return errors.Wrap(err, "getting ip")
    }
    if err := parsePrometheusScrapeTemplate(ip, cfg.PromTargetGrpcServerPort,
        cfg.PromTargetGrpcClientPort, cfg.PromTemplateFile, cfg.PromOutputFile); err != nil {
        return errors.Wrap(err, "parsing Prometheus scrape template")
    }
    if err := parsePrometheusDataSourceTemplate(ip, cfg.DsServerPort, cfg.DsTemplateFile, cfg.DsOutputFile); err != nil {
        return errors.Wrap(err, "parsing Prometheus datasource template")
    }
    return nil
}

func main() {
    if err := run(); err != nil {
        fmt.Println(err)
        os.Exit(1)
    }
}
It is a main program that, when invoked, will parse the templates to:
- obs/prometheus/prometheys.yaml
- obs/provisioning/datasources/datasource.yaml
Creating the dashboard in Grafana
Let’s launch Grafana so we can create our dashboard, export it to JSON and then save it under obs/provisioning/dashboards/. This way, whenever we launch Grafana, we’ll have it ready.
Here are the related targets in Makefile:
# ==============================================================================
# Metrics

.PHONY: parse-templates
## parse-templates: parses Prometheus scrapes and datasource templates
parse-templates:
    @ go run templateparser/templateparser.go

.PHONY: obs
## obs: runs both prometheus and grafana
obs: parse-templates
    @ docker-compose up

.PHONY: obs-stop
## obs-stop: stops both prometheus and grafana
obs-stop:
    @ docker-compose down -v
As we can see, when running make obs, we will first parse the template files and then we’ll launch both Grafana, Grafana Image Renderer and Prometheus.
make obs
Then, open http://localhost:3000/dashboards in the browser. For the first time when Grafana is launched, it will ask for login creds.
Login is admin, password is the one defined in GF_SECURITY_ADMIN_PASSWORD env var in .env file.
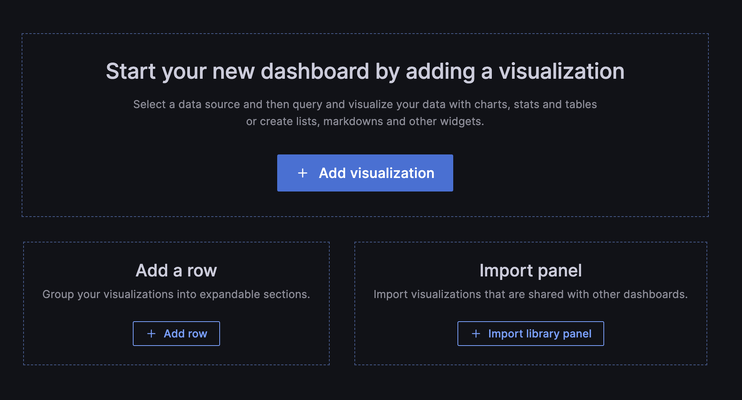
Click on New->New Dashboard->Add visualization:
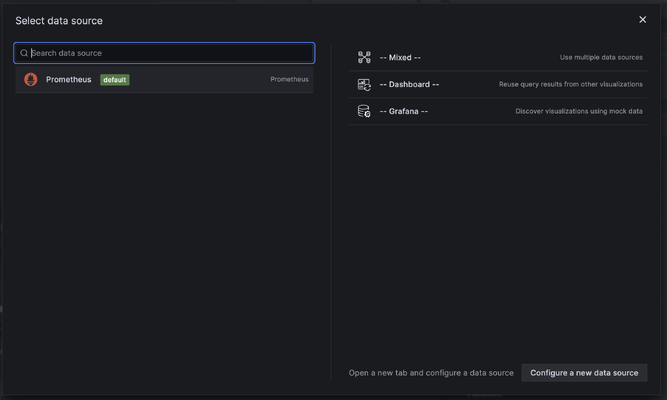
It will ask you to select a datasource. Select Prometheus:
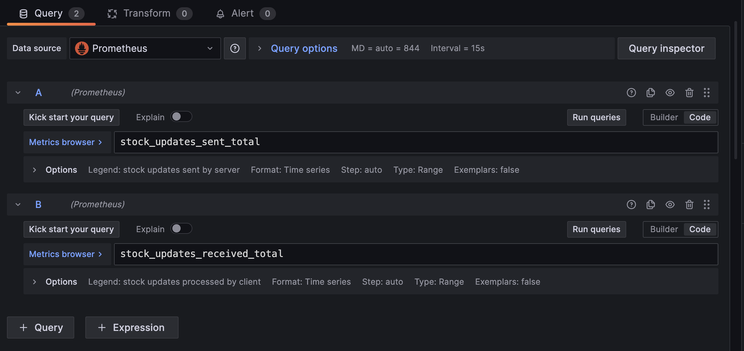
Then, add two queries:
- stock_updates_sent_total, which is a counter incremented by the gRPC server and scraped by Prometheus;
- stock_updates_received_total, which is a counder incremented by the gRPC client and also scraped by Prometheus
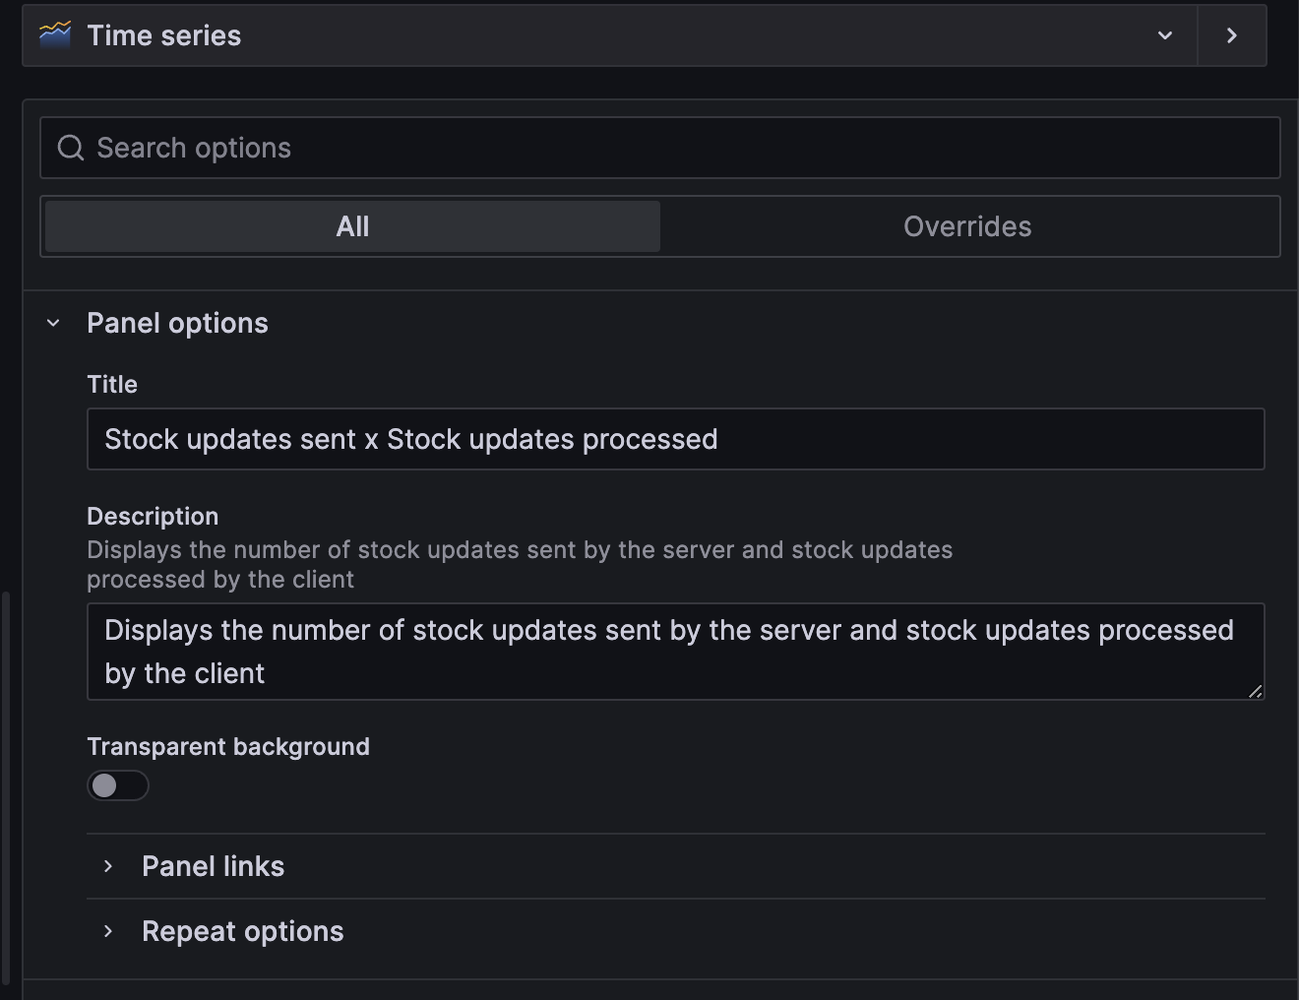
On the right side, set the desired title and description:
And under ‘Graph styles’, set ‘Bars’ as the style:

Save it. Then, set the refresh options:

Then, go to the dashboard settings and go to JSON model:
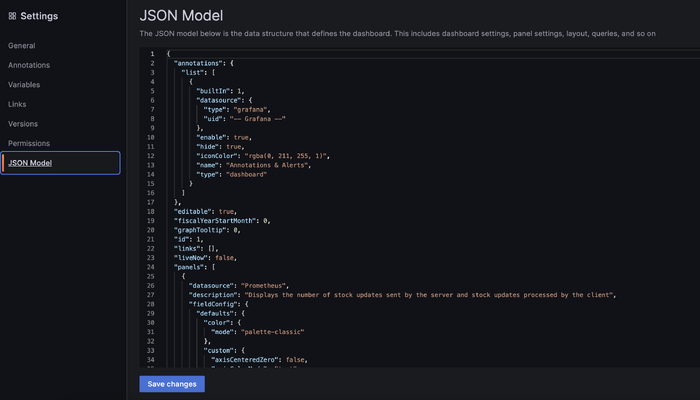
Copy this JSON and save it under obs/provisioning/dashboards/stock_updates_sent_vs_stock_updates_processed.json.
Notice: all the “datasource” entries on that json must be changed to refer to the Prometheus datasource by its name rather by its UID. Like this: “datasource”: “Prometheus”.
Now stop the containers:
make obs-stop
This will not only stop the containers, but delete its associated volumes.
Also, notice that in order for Grafana to recognize our dashboard, we have:
obs/provisioning/dashboards/dashboards.yaml
apiVersion: 1

providers:
- name: 'default'
  orgId: 1
  folder: ''
  type: file
  disableDeletion: false
  updateIntervalSeconds: 5
  options:
    path: /etc/grafana/provisioning/dashboards
This way we are telling Grafana to use the dashboard json file we created.
It’s show time!
Now comes the fun part of it all: let’s run both server and client and check the dashboard to see backpressure kicking in.
Here’s the complete Makefile that will help us:
# ==============================================================================
# Help

.PHONY: help
## help: shows this help message
help:
    @ echo "Usage: make [target]\n"
    @ sed -n 's/^##//p' ${MAKEFILE_LIST} | column -t -s ':' |  sed -e 's/^/ /'

# ==============================================================================
# Protofile compilation

.PHONY: proto
## proto: compile proto files
proto:
    @ rm -rf api/proto/gen/stockservice
    @ mkdir -p api/proto/gen/stockservice
    @ cd api/proto ; \
    protoc --go_out=gen/stockservice --go_opt=paths=source_relative --go-grpc_out=gen/stockservice --go-grpc_opt=paths=source_relative stockservice.proto

# ==============================================================================
# gRPC server execution

.PHONY: server
## server: runs gRPC server
server:
    @ go run cmd/main.go -i 5

.PHONY: client
## client: runs gRPC client
client:
    @ go run client/client.go

.PHONY: client-random-processing-time
## client-random-processing-time: runs gRPC client that sleeps at random times
client-random-processing-time:
    @ go run client/client.go -r

# ==============================================================================
# Metrics

.PHONY: parse-templates
## parse-templates: parses Prometheus scrapes and datasource templates
parse-templates:
    @ go run templateparser/templateparser.go

.PHONY: obs
## obs: runs both prometheus and grafana
obs: parse-templates
    @ docker-compose up

.PHONY: obs-stop
## obs-stop: stops both prometheus and grafana
obs-stop:
    @ docker-compose down -v
First scenario: client is fast enough to process updates
The test will last +- 5 min.
In one terminal, lauch Grafana and Prometheus as before:
make obs
In another terminal, launch the server:
make server
And in another terminal, launch the client:
make client
In client’s terminal, you’ll see the updates being logged:
STOCK SERVICE CLIENT : 2023/08/21 00:03:24.494881 client.go:101: main: initializing gRPC client

STOCK SERVICE CLIENT : 2023/08/21 00:03:29.501536 client.go:53: ticker:"AAPL" price:148.21 change:-1.79 changePercent:-1.20 volume:9359 openPrice:150.00 highPrice:148.80 lowPrice:147.65 marketCap:4157036 timestamp:"2023-08-21T00:03:29-04:00"

STOCK SERVICE CLIENT : 2023/08/21 00:03:30.504020 client.go:53: ticker:"AAPL" price:148.59 change:0.38 changePercent:0.26 volume:837 openPrice:150.00 highPrice:149.95 lowPrice:146.69 marketCap:80694138 timestamp:"2023-08-21T00:03:30-04:00"

STOCK SERVICE CLIENT : 2023/08/21 00:03:31.506216 client.go:53: ticker:"AAPL" price:150.75 change:2.16 changePercent:1.45 volume:3425 openPrice:150.00 highPrice:151.61 lowPrice:149.20 marketCap:55109555 timestamp:"2023-08-21T00:03:31-04:00"
Now, head to Grafana and click on the dashboard.
After 5 minutes, we click on the dashboard’s settings button,

And select “Share”:
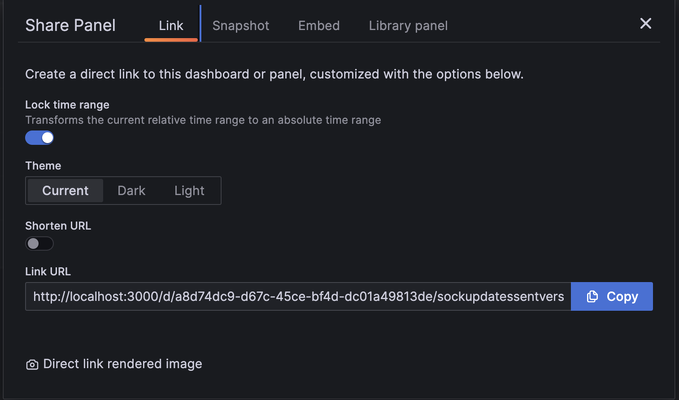
When clicking on “Direct link rendered image”, the dashboard’s snapshot will be opened in a new browser tab and you’ll be able to save it. Let’s see it:
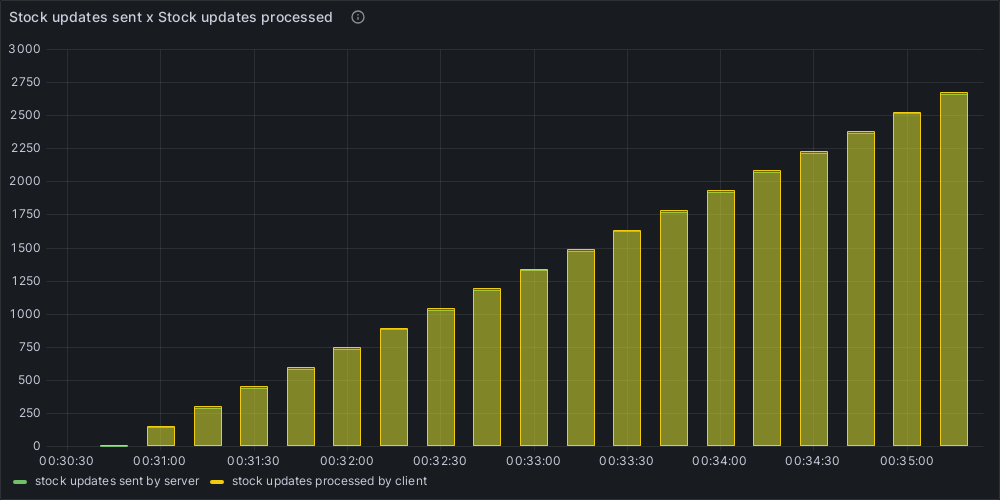
During this test, we see that the number of stock updates processed by the client (yellow) is virtually the same number of stock updates sent by the server (green), and it keeps growing in time. We can’t even see the green color for the number of messages sent by the server. It means that the server kept streaming messages to the client as the client responded quickly.
Now we’ll repeat the test, but this time using a client that will randomly sleep between 1 and 3 seconds:
make client-random-processing-time
Then we’ll repeat the steps to export the dashboard:
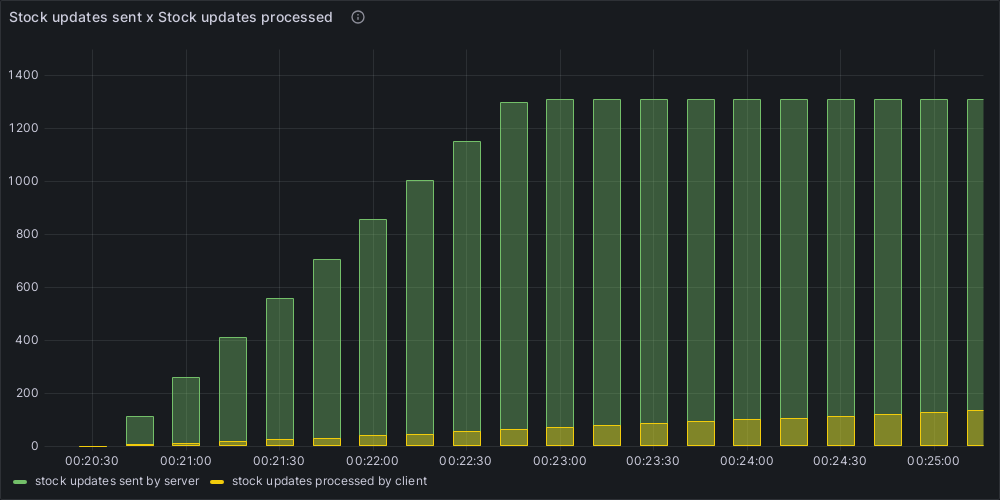
Now that’s a completely different scenario. See the number of stock updates sent by the server (green) is always greater than the number of stock updates processed by the client (yellow), and, after a certain amount of time, the server just stopped sending new messages (it stucked at +- 1330 counter), because it noticed that the client was struggling to process it.
So what happened here?
- As the client processes updates with random delays, there were times when it couldn’t keep up with the incoming data rate;
- gRPC’s underlying HTTP/2 protocol recognized that the client was lagging;
- The built-in flow control of HTTP/2 then sent a signal to the server to slow down its sending rate, even if it’s not explicitly coded in our server’s logic.
Conclusion
In our journey of setting up a gRPC server-client ecosystem, complete with Prometheus monitoring and Grafana visualization, we have touched upon various essential facets of distributed system design. One crucial aspect we deliberated upon is the idea of backpressure.
Backpressure is vital in maintaining the equilibrium and health of our distributed system. As data flows from the server to the client, or vice-versa, it is imperative that neither side becomes overwhelmed. Especially in real-time systems where the rate of data generation can be sporadic and sometimes exceedingly high, backpressure acts as a relief valve, ensuring that the consuming side has enough leeway to process data efficiently. Without such mechanisms, our system risks resource saturation, potential data loss, increased latency, and even catastrophic failures.
Setting up monitoring for a system, especially one involving GRPC communication, provides crucial visibility into its operations. In this guide, we walked through the steps to instrument both a GRPC server and client with Prometheus metrics, exposed those metrics via an HTTP endpoint, and visualized them using Grafana. The Docker-Compose setup simplified the deployment of both Prometheus and Grafana, ensuring a streamlined process.
By leveraging Grafana provisioning feature, we automated the setup of data sources and dashboards, making the monitoring system both robust and easily reproducible. This approach not only minimizes manual configurations but also ensures that dashboards and data sources are version controlled, fostering best practices for DevOps.