Java: centralized logging with Spring Boot, Elasticsearch, Logstash and Kibana
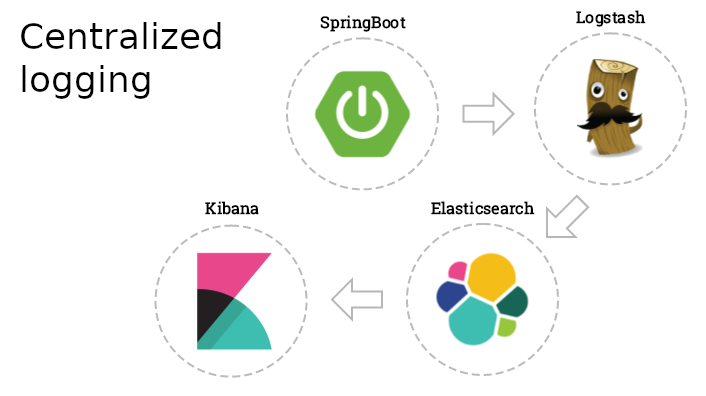
Logging is a crucial aspect of an application. And when we’re dealing with a distributed environment, like microservice architecture or having multiple instances running with the help of a load balancer, centralized logging becomes a necessity.
In this article, we’ll see how to enable centralized logging in a typical Spring Boot with the ELK stack, which is comprised of Elasticsearch, Logstash and Kibana.
Meet the ELK stack

In a nutshell, this is how centralized logging works:
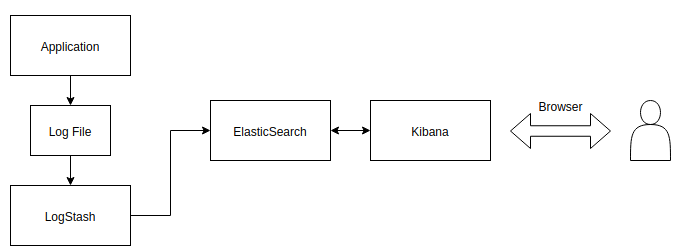
The application will store logs into a log file. Logstash will read and parse the log file and ship log entries to an Elasticsearch instance. Finally, we will use Kibana ( Elasticsearch web frontend) to search and analyze the logs.
We’ll use a CRUD RESTful API from a previous post as the application.
To achieve this, we need to put several pieces together. Let’s begin.
Install Elasticsearch
Just follow the official instructions: https://www.elastic.co/downloads/elasticsearch
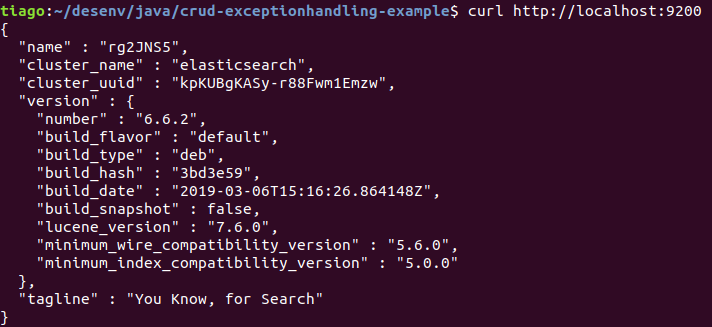
After that, let’s check if it’s running:
curl -XGET http://localhost:9200
You should see an output similar to this:
Install Logstash
Just follow the official instructions: https://www.elastic.co/downloads/logstash
Install Kibana
Finally, the last piece. Just follow the official instructions: https://www.elastic.co/products/kibana
Point your browser to http://localhost:5601 (if Kibana page shows up, we’re good — we’ll configure it later).
Configure Spring Boot
To have Logstash to ship logs to Elasticsearch, we need to configure our application to store logs into a file. All we need to do is to configure the log file name in ‘ src/main/resources/application.yml’:
logging:
  file: application.log
And the log file will be automatically rotated on a daily basis.
Configure Logstash to Understand Spring Boot’s Log File Format
Now comes the tricky part. We need to create Logstash config file.
Typical Logstash config file consists of three main sections: input, filter and output:
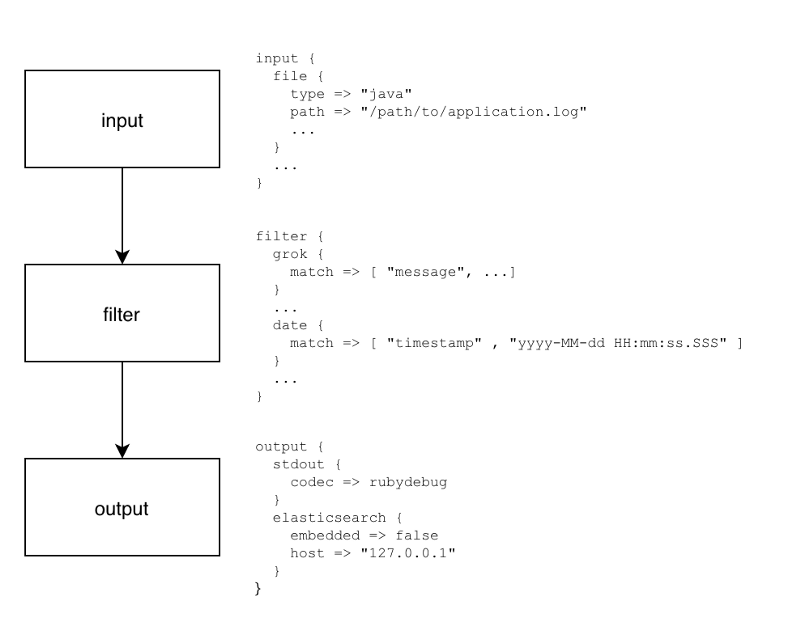
Each section contains plugins that do relevant part of the processing (such as file input plugin that reads log events from a file or Elasticsearch output plugin which sends log events to Elasticsearch).
We’ll create a file called ‘logstash.conf’ that will be used in Logstash initialization that will be showed soon. It will be placed under ‘src/main/resources’ directory.
Let’s dig in each section.
Input section
It defines from where Logstash will read input data.
This is the input section:
input {
  file {
    type => "java"
    path => "/home/tiago/desenv/java/crud-exceptionhandling-example/application.log"
    codec => multiline {
      pattern => "^%{YEAR}-%{MONTHNUM}-%{MONTHDAY} %{TIME}.*"
      negate => "true"
      what => "previous"
    }
  }
}
Explanation:
1) We’re using file plugin
2) type is set to java - it’s just an additional piece of metadata in case you will use multiple types of log files in the future
3) path is the absolute path to the log file. It must be absolute - Logstash is picky about this
4) We’re using multiline codec, which means that multiple lines may correspond to a single log event
5) In order to detect lines that should logically be grouped with a previous line we use a detection pattern:
5.1) pattern => ”^%{YEAR}-%{MONTHNUM}-%{MONTHDAY} %{TIME}.*“: Each new log event needs to start with date
5.2) negate => “true”: if it doesn’t start with a date…
5.3) what => “previous” → …then it should be grouped with a previous line.
File input plugin, as configured, will tail the log file (e.g. only read new entries at the end of the file). Therefore, when testing, in order for Logstash to read something you will need to generate new log entries.
Filter section
It contains plugins that perform intermediary processing on a log event. In our case, event will either be a single log line or multiline log event grouped according to the rules described above.
In the filter section we will do:
- Tag a log event if it contains a stacktrace. This will be useful when searching for exceptions later on
- Parse out (or grok, in Logstash terminology) timestamp, log level, pid, thread, class name (logger actually) and log message
- Specified timestamp field and format - Kibana will use that later for time-based searches
This is the filter section:
filter {
  #If log line contains tab character followed by 'at' then we will tag that entry as stacktraceif [message] =~ "\tat" {
    grok {
      match => ["message", "^(\tat)"]
      add_tag => ["stacktrace"]
    }
  }

  #Grokking Spring Boot's default log format
  grok {
    match => [ "message",
               "(?<timestamp>%{YEAR}-%{MONTHNUM}-%{MONTHDAY} %{TIME})  %{LOGLEVEL:level} %{NUMBER:pid} --- \[(?<thread>[A-Za-z0-9-]+)\] [A-Za-z0-9.]*\.(?<class>[A-Za-z0-9#_]+)\s*:\s+(?<logmessage>.*)",
               "message",
               "(?<timestamp>%{YEAR}-%{MONTHNUM}-%{MONTHDAY} %{TIME})  %{LOGLEVEL:level} %{NUMBER:pid} --- .+? :\s+(?<logmessage>.*)"
             ]
  }

  #Parsing out timestamps which are in timestamp field thanks to previous grok section
  date {
    match => [ "timestamp" , "yyyy-MM-dd HH:mm:ss.SSS" ]
  }
}
Explanation:
1) if [message] =~ “\tat”: if message contains tab character followed by at then…
2) … use grok plugin to tag stacktraces:
- match => [“message”, “^(\tat)”]: when message matches beginning of the line followed by tab followed by at then…
- add_tag => [“stacktrace”]: … tag the event with stacktrace tag
3) Use grok plugin for regular Spring Boot log message parsing:
- First pattern extracts timestamp, level, pid, thread, class name (this is actually logger name) and the log message.
- Unfortunately, some log messages don’t have logger name that resembles a class name (for example, Tomcat logs) hence the second pattern that will skip the logger/class field and parse out timestamp, level, pid, thread and the log message.
4) Use date plugin to parse and set the event date:
- match => [ “timestamp” , “yyyy-MM-dd HH:mm:ss.SSS” ]: timestamp field (grokked earlier) contains the timestamp in the specified format
Output section
It contains output plugins that send event data to a particular destination. Outputs are the final stage in the event pipeline. We will be sending our log events to stdout (console output, for debugging) and to Elasticsearch.
This is the output section:
output {
  # Print each event to stdout, useful for debugging. Should be commented out in production.# Enabling 'rubydebug' codec on the stdout output will make logstash# pretty-print the entire event as something similar to a JSON representation.
  stdout {
    codec => rubydebug
  }

  # Sending properly parsed log events to elasticsearch
  elasticsearch {
    hosts=>["localhost:9200"]
    index=>"logstash-%{+YYYY.MM.dd}"
  }
}
Explanation:
1) We are using multiple outputs: stdout and elasticsearch.
2) stdout { … }: stdout plugin prints log events to standard output (console)
- codec => rubydebug: pretty print events using JSON-like format
3) elasticsearch { … }: elasticsearch plugin sends log events to Elasticsearch server.
- hosts => [“localhost:9200”]: hostname where Elasticsearch is located - in our case, localhost
- index=>”logstash-%{+YYYY.MM.dd}”: the index in Elasticsearch for which the data will be streamed to. You can name it with your application’s name if you want.
Putting it all together
Finally, the three parts - input, filter and output - need to be copy-pasted together and saved into logstash.conf config file. Once the config file is in place and Elasticsearch is running, we can run Logstash:
$ /path/to/logstash/bin/logstash -f src/main/resources/logstash.conf
If everything went well, Logstash is now shipping log events to Elasticsearch. It may take a while before presenting an output like this:
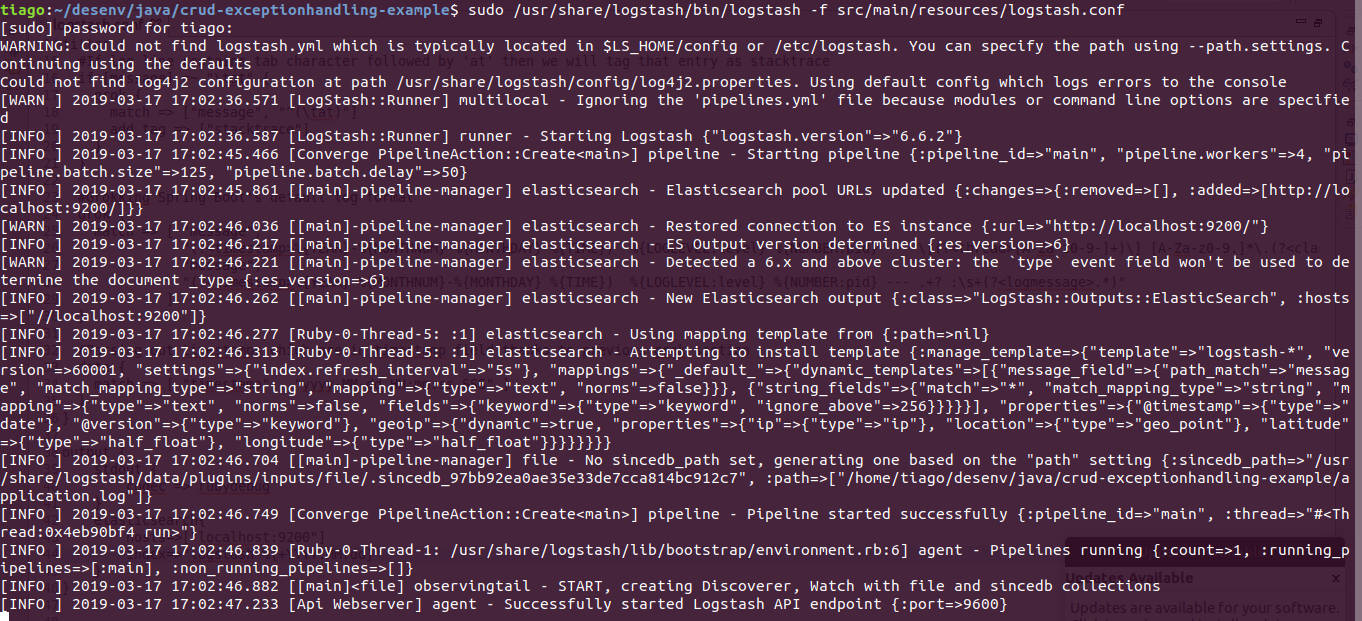
Notice these lines:
[INFO ] 2019-03-17 17:44:18.226 [[main]-pipeline-manager] elasticsearch - New Elasticsearch output {:class=>"LogStash::Outputs::ElasticSearch", :hosts=>["//localhost:9200"]}
[INFO ] 2019-03-17 17:44:18.249 [Ruby-0-Thread-5: :1] elasticsearch - Using mapping template from {:path=>nil}
[INFO ] 2019-03-17 17:44:18.271 [Ruby-0-Thread-5: :1] elasticsearch - Attempting to install template {:manage_template=>{"template"=>"logstash-*", "version"=>60001, "settings"=>{"index.refresh_interval"=>"5s"}, "mappings"=>{"_default_"=>{"dynamic_templates"=>[{"message_field"=>{"path_match"=>"message", "match_mapping_type"=>"string", "mapping"=>{"type"=>"text", "norms"=>false}}}, {"string_fields"=>{"match"=>"*", "match_mapping_type"=>"string", "mapping"=>{"type"=>"text", "norms"=>false, "fields"=>{"keyword"=>{"type"=>"keyword", "ignore_above"=>256}}}}}], "properties"=>{"@timestamp"=>{"type"=>"date"}, "@version"=>{"type"=>"keyword"}, "geoip"=>{"dynamic"=>true, "properties"=>{"ip"=>{"type"=>"ip"}, "location"=>{"type"=>"geo_point"}, "latitude"=>{"type"=>"half_float"}, "longitude"=>{"type"=>"half_float"}}}}}}}}
[INFO ] 2019-03-17 17:44:18.585 [[main]-pipeline-manager] file - No sincedb_path set, generating one based on the "path" setting {:sincedb_path=>"/usr/share/logstash/data/plugins/inputs/file/.sincedb_97bb92ea0ae35e33de7cca814bc912c7", :path=>["/home/tiago/desenv/java/crud-exceptionhandling-example/application.log"]}
Seems that an index called ‘ logstash-*‘ was created and the log file ‘ /home/tiago/desenv/java/crud-exceptionhandling-example/application.log’ was correctly located.
Let’s check if the index was really created at Elasticsearch by this command:
~$ curl -X GET "localhost:9200/_cat/indices?v"
And this is the output. It was created as expected:
health status index               uuid                   pri rep docs.count docs.deleted store.size pri.store.size
yellow open   logstash-2019.03.17 ReyKaZpgRq659xiNXWcUiw   5   1         77            0    234.5kb        234.5kb
green  open   .kibana_1           o-dbTdTZTu-MGR3ECzPteg   1   0          4            0     19.7kb         19.7kb
Configure Kibana
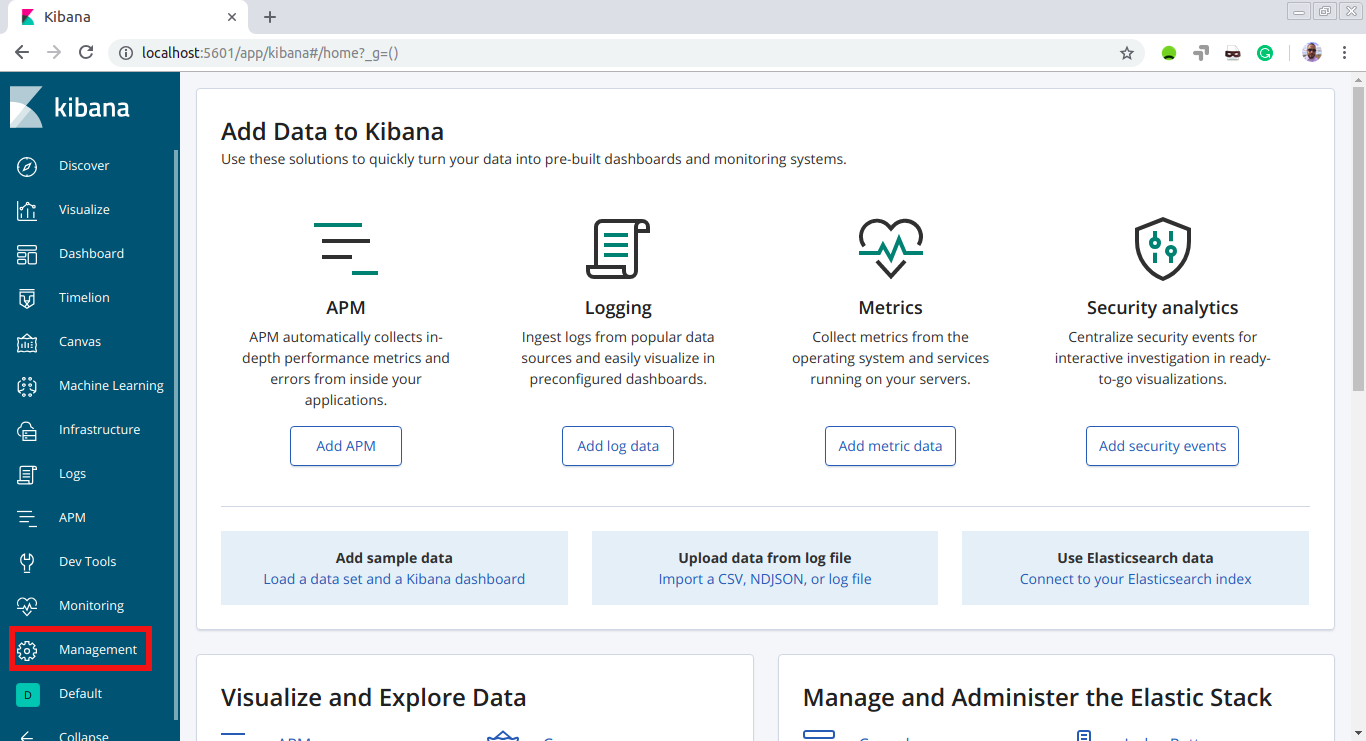
Let’s open Kibana UI at http://localhost:5601. Click on ‘Management’:
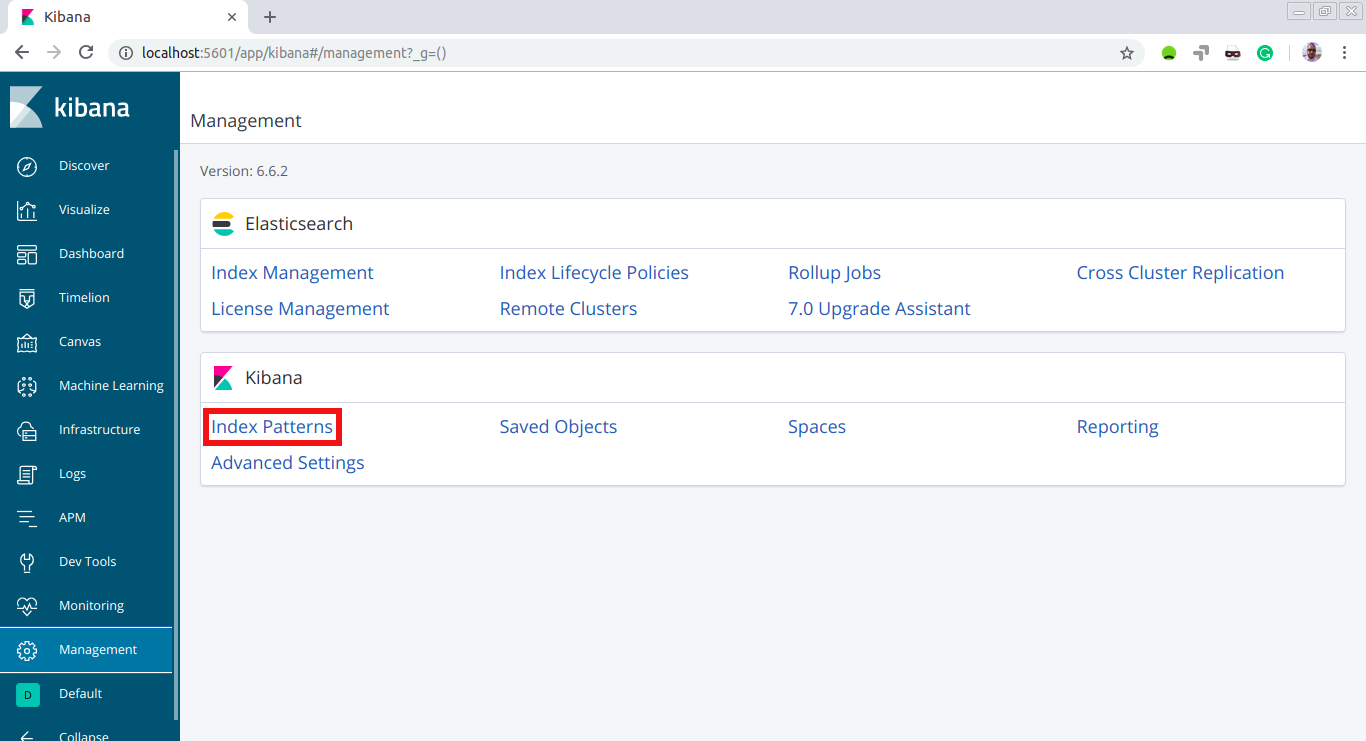
Now click on ‘Index Patterns’ under ‘Kibana’:
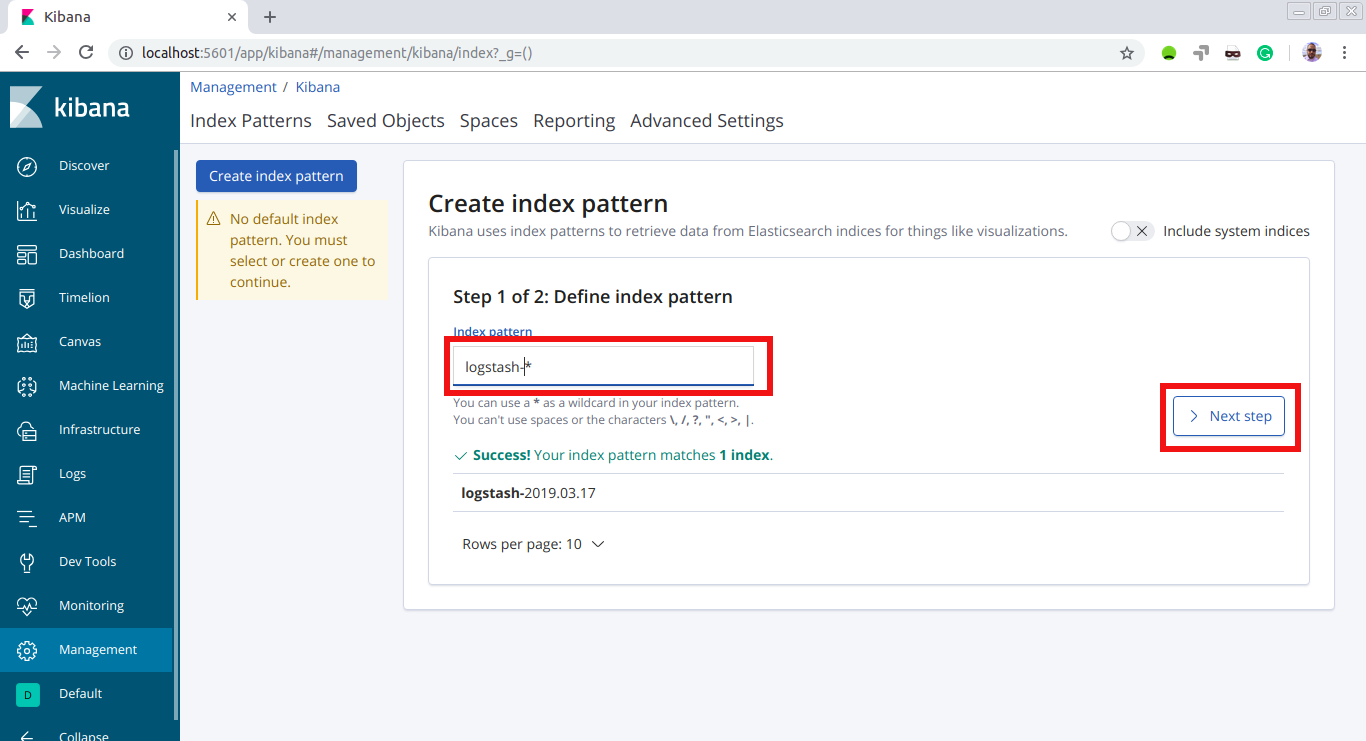
And here we put the name of the index that was created in Elasticsearch: ‘ logstash-*‘. Then, hit ‘Next step’:
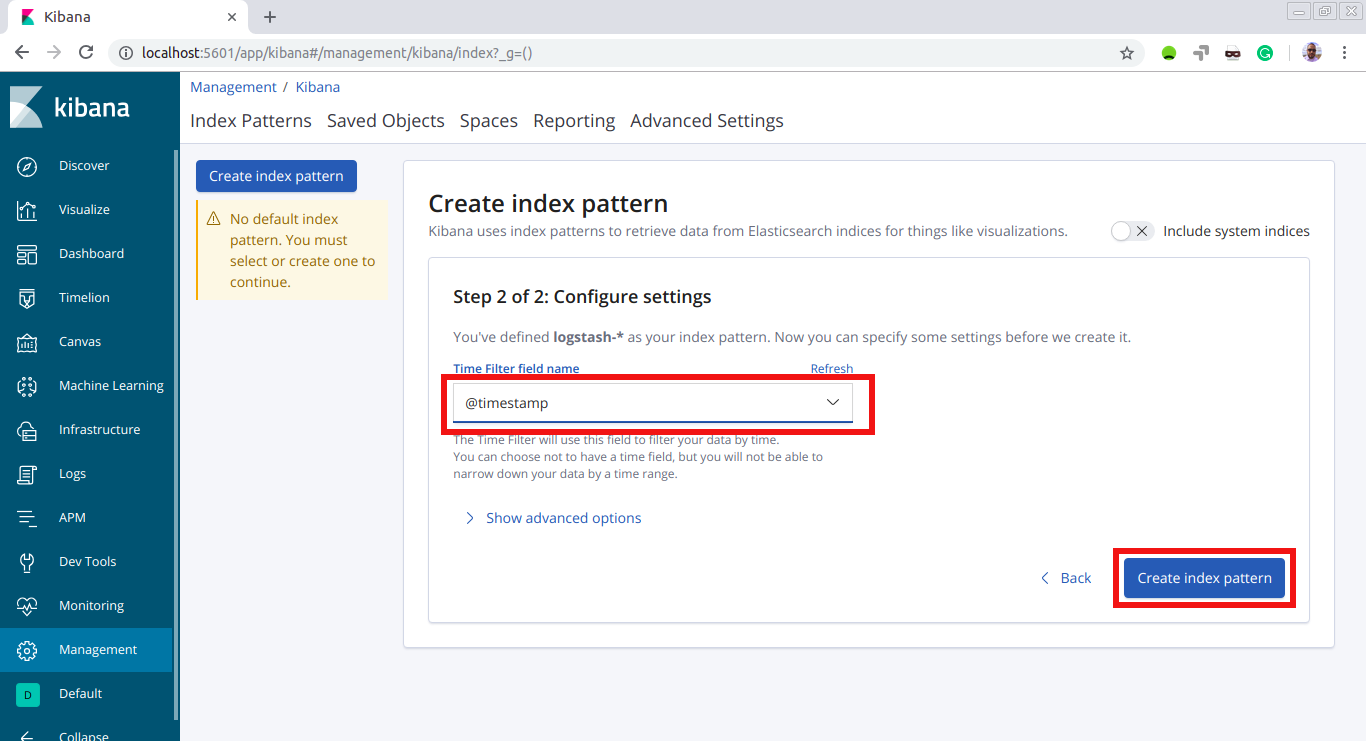
Now we choose ‘@timestamp’ as the field to filter data by time and then hit ‘Create index pattern’:
It’s show time!
Let’s launch the application and perform some operations in order to generate some data. Then we’ll check them later using the Kibana UI.
Fire up the server:
$ mvn spring-boot:run
So, as mentioned earlier, our app is a CRUD RESTful API from a previous article.
Let’s call the endpoint that lists all students. In the controller we have:
private static final Logger LOGGER = LoggerFactory.getLogger(StudentController.class);

/**
 * Get all students
 *
 * @return the list of students
 */
@GetMapping("/students")
public List<StudentDTO> getAllStudents() {
  List<Student> students = service.findAll();

  LOGGER.info(String.format("getAllStudents() returned %s records", students.size()));

  return students.stream().map(student -> convertToDTO(student)).collect(Collectors.toList());
}
Let’s call it:

In the server’s log we have:

And if we take a look at what’s going on with Logstash, we see that it was captured:
{
          "path" => "/home/tiago/desenv/java/crud-exceptionhandling-example/application.log",
          "host" => "tiagomelo",
           "pid" => "22174",
         "class" => "StudentController",
       "message" => "2019-03-17 23:14:58.197  INFO 22174 --- [http-nio-8080-exec-1] com.tiago.controller.StudentController   : getAllStudents() returned 6 records",
      "@version" => "1",
    "@timestamp" => 2019-03-18T02:14:58.197Z,
    "logmessage" => "getAllStudents() returned 6 records",
          "type" => "java",
         "level" => "INFO",
     "timestamp" => "2019-03-17 23:14:58.197",
        "thread" => "http-nio-8080-exec-1"
}
Now let’s perform an action that will log an error. We can do it by trying to delete an inexisting student, for example. This is our exception handler:
private static final Logger LOGGER = LoggerFactory.getLogger(ExceptionHandlingController.class);

/**
 * This exception is thrown when a resource is not found
 *
 * @param ex
 * @return {@link ExceptionResponse}
 */
@ExceptionHandler(ResourceNotFoundException.class)
public ResponseEntity<ExceptionResponse> resourceNotFound(ResourceNotFoundException ex) {
  ExceptionResponse response = new ExceptionResponse();
  response.setErrorCode("Not Found");
  response.setErrorMessage(ex.getMessage());

  LOGGER.error(String.format("ResourceNotFoundException: %s", ex.getMessage()));

  return new ResponseEntity<ExceptionResponse>(response, HttpStatus.NOT_FOUND);
}
Let’s call it:

In the server’s log we have:

And if we take a look at what’s going on with Logstash, we see that it was captured:
{
          "path" => "/home/tiago/desenv/java/crud-exceptionhandling-example/application.log",
          "host" => "tiagomelo-zoom",
           "pid" => "22174",
         "class" => "ExceptionHandlerExceptionResolver",
       "message" => "2019-03-17 23:20:03.729  WARN 22174 --- [http-nio-8080-exec-3] .m.m.a.ExceptionHandlerExceptionResolver : Resolved [com.tiago.exception.ResourceNotFoundException: Student not found with id: '323']",
      "@version" => "1",
    "@timestamp" => 2019-03-18T02:20:03.729Z,
    "logmessage" => "Resolved [com.tiago.exception.ResourceNotFoundException: Student not found with id: '323']",
          "type" => "java",
         "level" => "WARN",
     "timestamp" => "2019-03-17 23:20:03.729",
        "thread" => "http-nio-8080-exec-3"
}
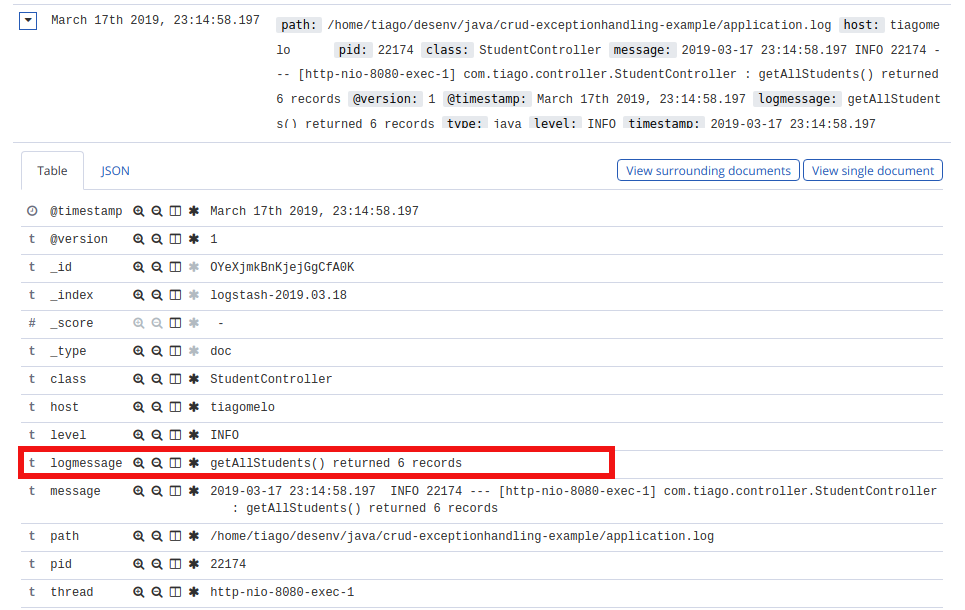
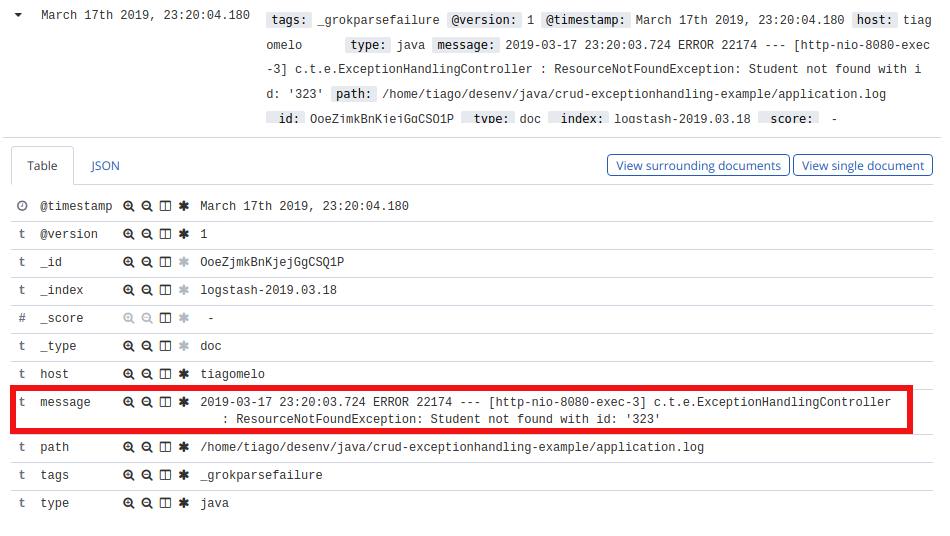
We’ve performed two actions: listed all students and tried to delete an inexisting one. Now it’s time to visualize them in Kibana UI at http://localhost:5601.
This is the log of the first operation performed, listing all students:
And this is the log of the second operation performed, deleting an inexisting student:
Conclusion
Through this simple example, we learned how we can integrate a Spring Boot application with ELK stack in order to have centralized logging.
Download the source
Here: https://bitbucket.org/tiagoharris/crud-exceptionhandling-example/src/master/