Scaling inventory reservations in PostgreSQL
Inventory reservation looks like a simple problem.
A product has 1,000 units in stock. When a customer starts checkout, we reserve one:
UPDATE inventory
SET available = available - 1
WHERE product_id = $1
  AND available > 0
RETURNING available;
Simple, transactional and correct. Until a flash sale sends hundreds of checkouts for the same product at the same time, and every one of them needs to update the same row.
The usual answer is to stop counting and start claiming: represent stock as individual rows and let concurrent transactions grab different ones with
FOR UPDATE SKIP LOCKED
Shopify recently described doing exactly that when they moved checkout reservations from Redis to MySQL in Scaling inventory reservations: a small pool of claimable rows per item, claimed with SKIP LOCKED, inside the same database as the inventory ledger so that reservations and payments can be part of the same transaction.
I wanted to know how far that idea goes in PostgreSQL, so I pushed it to the worst case: up to 1,000 concurrent workers all reserving the same product, with four different strategies, while watching what Postgres was waiting on through Prometheus and Grafana.
The short version:
SKIP LOCKEDdoesn’t remove contention. It moves it. What scales is making concurrent transactions stop touching the same rows and the same pages, and wait events tell you where the contention went.
| Strategy | Where the contention ended up | At 1,000 workers |
|---|---|---|
| a counter row | the row | 1,450/s, p99 3.2 s |
units + SKIP LOCKED |
the first pages of the table and index | 1,004/s, p99 19 s |
| a small reservation pool | the pool’s pages and its refill lock | 1,941/s, p99 21 s |
| units split into buckets | mostly nowhere: what’s left is the cost of committing | 17,069/s, p99 317 ms |
The rest of this article is how each strategy got there.
All code is available at https://github.com/tiagomelo/psql-scaling-inventory-reservations.
Each worker records its own latencies, so the p50/p95/p99 in the tables are exact percentiles. The same observations feed a Prometheus histogram and counter for the dashboard:
ReservationDuration: prometheus.NewHistogramVec(
	prometheus.HistogramOpts{
		Name: "inventory_reservation_duration_seconds",
		Help: "Time required to reserve inventory",
		Buckets: prometheus.ExponentialBuckets(
			0.0005,
			2,
			18,
		),
	},
	[]string{"strategy"},
),
Reservations: prometheus.NewCounterVec(
	prometheus.CounterOpts{
		Name: "inventory_reservations_total",
		Help: "Inventory reservation attempts",
	},
	[]string{"strategy", "result"},
),
The Go database/sql pool is exported too. Time spent waiting for a connection stayed at zero for the whole benchmark, so the application side was never the bottleneck.
Environment: Apple M3 Pro, Docker Desktop with 12 CPUs and 8 GB, plugged in and kept awake. Absolute numbers depend a lot on hardware, especially on how fast the disk can flush WAL. The shapes are what matter.
Wait events: where the contention goes
The most useful metric in this whole experiment is the wait event. Every non-idle PostgreSQL backend is either running on CPU or waiting for something, and pg_stat_activity says what:
Lock— a heavyweight lock: a row (tuple), another transaction (transactionid), an advisory lock;LWLock— a lightweight internal lock: a page in shared buffers (BufferContent), the WAL (WALWrite), the lock manager itself (LockManager);IO— the disk, e.g.WalSync;- no wait event — on CPU.
postgres_exporter doesn’t export them by default, so I added a custom query:
pg_wait_events:
  query: |
    SELECT
        coalesce(wait_event_type, 'CPU') AS wait_event_type,
        coalesce(wait_event, 'CPU') AS wait_event,
        count(*) AS count
    FROM pg_stat_activity
    WHERE datname = current_database()
      AND backend_type = 'client backend'
      AND state <> 'idle'
      AND pid <> pg_backend_pid()
    GROUP BY 1, 2
  metrics:
    - wait_event_type:
        usage: "LABEL"
        description: "Wait event type"
    - wait_event:
        usage: "LABEL"
        description: "Wait event"
    - count:
        usage: "GAUGE"
        description: "Number of non-idle client backends per wait event"
Sampled every 5 seconds, that gives a profile of where time goes for every run. Every claim about contention below comes from it. (Custom queries are deprecated upstream, but still the simplest way to get this into Prometheus. Similar queries export WAL position, table and index sizes and dead tuples.)
Strategy 1: the counter
CREATE TABLE IF NOT EXISTS inventory (
    product_id BIGINT PRIMARY KEY,
    available  INTEGER NOT NULL CHECK (available >= 0)
);
// Reserve implements Strategy.
func (Counter) Reserve(ctx context.Context, db *sql.DB, productID int64, quantity int) error {
	var remaining int
	err := db.QueryRowContext(
		ctx,
		`
		UPDATE inventory
		SET available = available - $2
		WHERE product_id = $1
		  AND available >= $2
		RETURNING available
		`,
		productID,
		quantity,
	).Scan(&remaining)
	if errors.Is(err, sql.ErrNoRows) {
		return ErrOutOfStock
	}
	return err
}
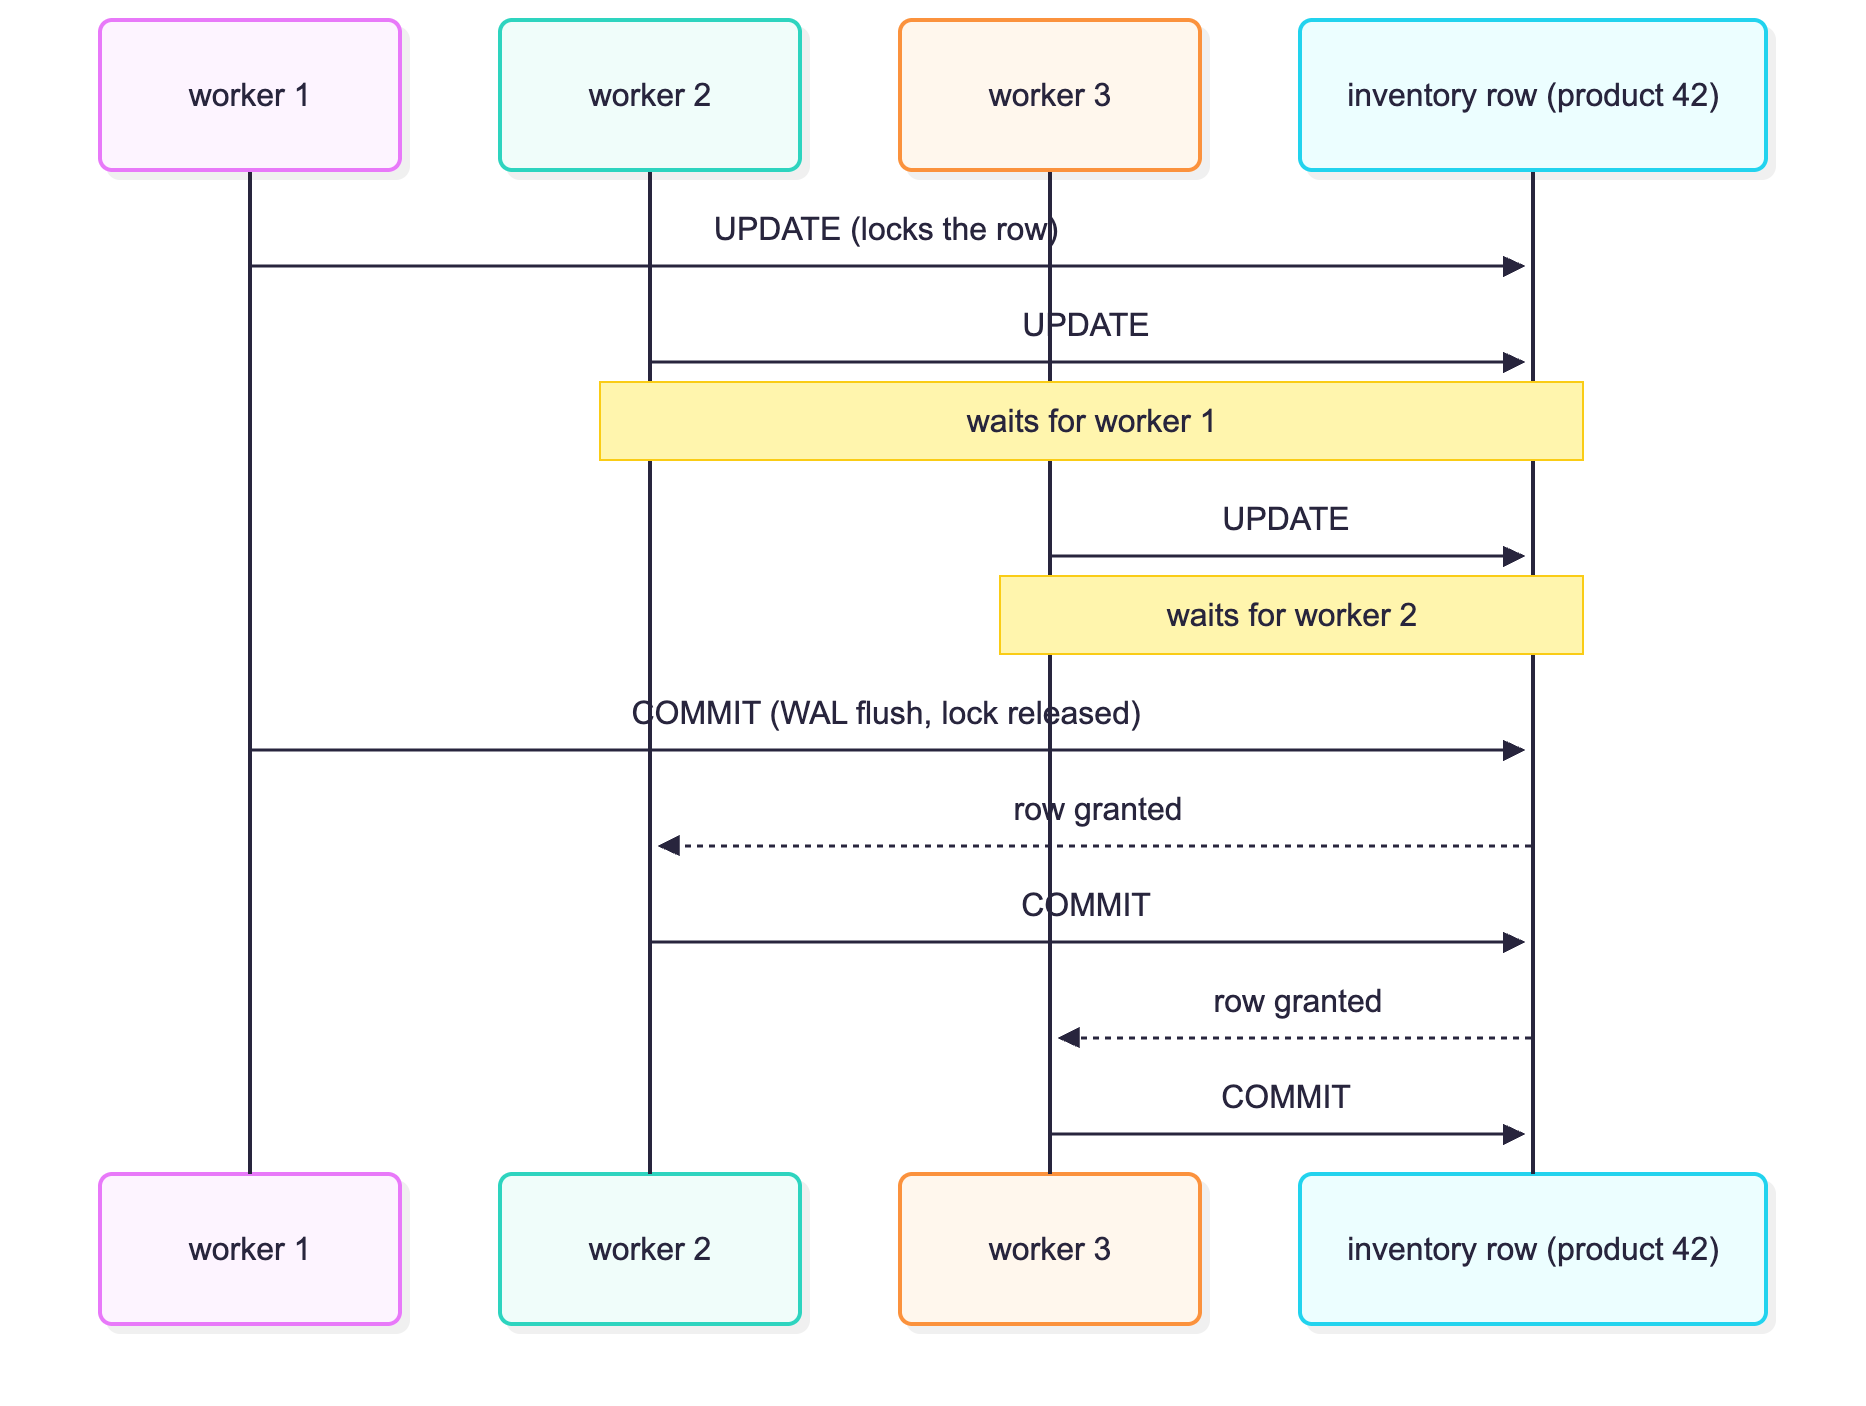
Atomic, impossible to oversell, nothing to maintain. But every reservation for the product needs an exclusive lock on the same row, held until commit, and a commit waits for the WAL to be flushed:
| Workers | Reservations/s | p50 | p99 | Top wait events (average backends) |
|---|---|---|---|---|
| 1 | 2,599 | 0.37 ms | 0.73 ms | IO:WalSync 1 |
| 10 | 5,216 | 1.46 ms | 7.42 ms | Lock:transactionid 6, LWLock:LockManager 2 |
| 100 | 3,107 | 22.17 ms | 150.49 ms | LWLock:LockManager 50, Lock:transactionid 38, Lock:tuple 8 |
| 1000 | 1,450 | 472.20 ms | 3,198.61 ms | LWLock:LockManager 417, Lock:tuple 405, Lock:transactionid 78 |
It peaks at 10 workers and then gets slower with every worker you add. The wait events are a textbook hot row: Lock:transactionid is waiting for the transaction that holds the row to commit, Lock:tuple is waiting in line for the right to wait. From 100 workers on, LWLock:LockManager takes over: the lock manager itself is contended just managing the queue. At 1,000 workers, half of all checkouts wait almost half a second to decrement an integer.
Contention: one row.
Strategy 2: units with SKIP LOCKED
Instead of a number, one row per unit of stock:
CREATE TABLE IF NOT EXISTS reservation_units (
    id             BIGSERIAL PRIMARY KEY,
    product_id     BIGINT NOT NULL,
    reservation_id UUID,
    reserved_at    TIMESTAMPTZ
);

CREATE INDEX IF NOT EXISTS idx_reservation_units_available
ON reservation_units (id)
WHERE reservation_id IS NULL;
A reservation claims the first available unit, skipping the ones other transactions have locked:
WITH candidate AS (
    SELECT id
    FROM reservation_units
    WHERE product_id = $1
      AND reservation_id IS NULL
    ORDER BY id
    LIMIT $3
    FOR UPDATE SKIP LOCKED
)
UPDATE reservation_units ru
SET reservation_id = $2,
    reserved_at = now()
FROM candidate
WHERE ru.id = candidate.id
RETURNING ru.id
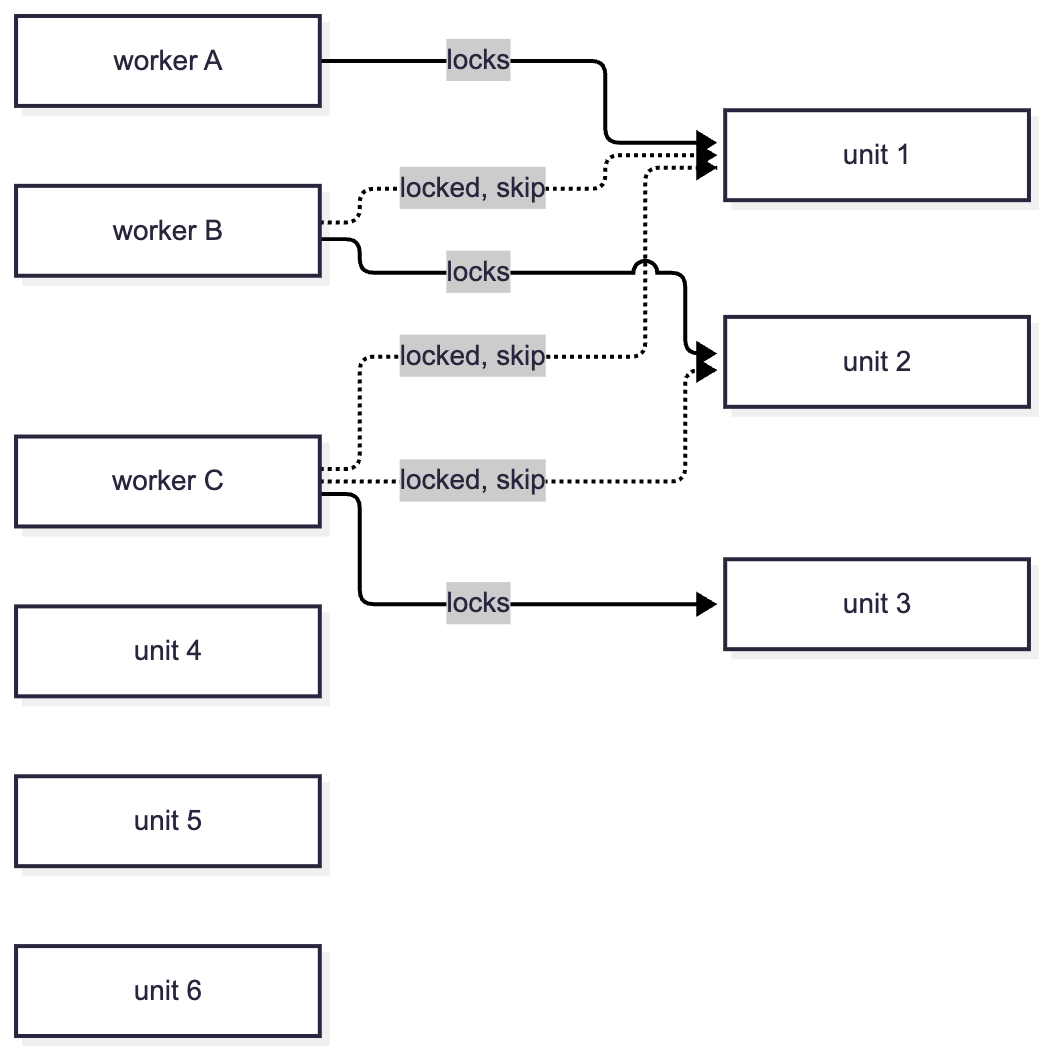
That’s the theory. Two caveats first.
SKIP LOCKED changes semantics. The query no longer sees every available unit, only the ones it can lock right now. That’s fine for “give me a unit I can claim”, wrong for “how much stock do we have”. It also means that near the end of the stock, a request can be refused while units are briefly locked by a transaction that’s about to roll back. Inventory is never oversold, but it can be undersold for a moment.
Check that the index is used. My first version indexed (product_id, id) WHERE reservation_id IS NULL, the natural choice. With every unit belonging to the same product, product_id filtered nothing, that index was bigger than the primary key, and the planner walked the primary key instead, stepping over every unit already reserved:
 Index Scan using reservation_units_pkey on reservation_units
   Filter: ((reservation_id IS NULL) AND (product_id = 42))
   Rows Removed by Filter: 20000
   Buffers: shared hit=33619
 Execution Time: 7.419 ms
Even with one worker, it was 3.4× slower than the counter. Indexing (id) fixed the plan (0.07 ms). With many products, product_id would earn its place in the index; with test data that doesn’t look like production, EXPLAIN is the only way to know.
With the right index:
| Workers | Reservations/s | p50 | p99 | Top wait events (average backends) |
|---|---|---|---|---|
| 1 | 2,118 | 0.46 ms | 0.79 ms | IO:WalSync 1 |
| 25 | 11,593 | 1.97 ms | 5.15 ms | LWLock:BufferContent 12, LWLock:WALWrite 6 |
| 100 | 7,209 | 6.26 ms | 123.12 ms | LWLock:BufferContent 36, LWLock:LockManager 33, Lock:transactionid 12 |
| 250 | 3,051 | 15.47 ms | 1,230.81 ms | LWLock:LockManager 119, Lock:transactionid 60, LWLock:BufferContent 38 |
| 1000 | 1,004 | 16.80 ms | 19,118.23 ms | LWLock:LockManager 358, LWLock:BufferContent 328, Lock:transactionid 231 |
SKIP LOCKED more than doubles the counter’s peak, at 25 workers. Then it collapses, and at 1,000 workers it’s slower than the counter, with a 19-second p99 and a worst case of 33 seconds.
No backend waits on another’s row anymore. The contention moved in three ways.
1. To the first pages
ORDER BY id LIMIT 1 sends every worker to the lowest available id. They all descend the same index path, read the same leaf page, and try to lock tuples on the same heap page. Each one skips the rows the others have locked, but to do that it has to read the page, and reading a page means taking a lock on it. That’s LWLock:BufferContent. The hot row became a hot page.
2. To the dead entries
Reserving a unit updates it, so its old version is dead, and its entry in the partial index still points to it until vacuum removes it. Every claim starts at the beginning of the index and steps over all of those entries. After 20,000 reservations, one claim touched 80 buffers instead of 5. Autovacuum can’t keep up with this write rate: the table accumulated over 350,000 dead tuples within a single 30-second run.
3. Back to waiting on transactions
The surprising one. From 100 workers on, sessions were waiting on Lock:transactionid, waiting for another transaction to finish, which is exactly what SKIP LOCKED is supposed to avoid. Caught in pg_locks during a 500-worker run:
| locktype | mode | granted | wait_event | query |
|---|---|---|---|---|
transactionid |
ShareLock |
f |
transactionid |
WITH candidate AS ( SELECT id FROM reservation_units ... |
My reading of the PostgreSQL 18 source (heap_lock_tuple in heapam.c): with SKIP LOCKED, when the row version found through the index was just updated by a transaction that has already committed, PostgreSQL follows the update chain to lock the newer version (heap_lock_updated_tuple), and that path waits for in-progress lockers unconditionally. With hundreds of workers hitting the same freshly updated rows at the head of the index, some end up queued behind each other. I couldn’t trigger it with two psql sessions; at a few hundred workers it shows up constantly.
Contention: the first pages of the table and the index, plus waits on other claimers.
Strategy 3: a small reservation pool
Shopify’s design differs from strategy 2 in two ways that matter here:
- the set of claimable rows is small and bounded: at most 1,000 per item, refilled from the inventory ledger, which remains the source of truth;
- reserving a unit deletes it from that pool and records the reservation in another table.
Their post doesn’t include the full SQL, and some of their work was about MySQL specifics that don’t apply to PostgreSQL (gap locks under REPEATABLE READ, two row locks per reservation through the clustered index). So this is a PostgreSQL strategy inspired by their design, not a reproduction of it. It only covers the reserve step: no multi-item carts, no claim at payment, no expiry.
I’ll call it a reservation pool to avoid confusion with connection pools: the up to 1,000 rows of reservation_pool that belong to one product.
CREATE TABLE IF NOT EXISTS reservation_pool (
    product_id BIGINT NOT NULL,
    id         BIGSERIAL,
    PRIMARY KEY (product_id, id)
);

CREATE TABLE IF NOT EXISTS reserved_quantities (
    reservation_id UUID PRIMARY KEY,
    product_id     BIGINT NOT NULL,
    quantity       INTEGER NOT NULL,
    reserved_at    TIMESTAMPTZ NOT NULL DEFAULT now()
);
Claiming deletes units from the pool and records the reservation, in one statement:
WITH candidate AS (
    SELECT id
    FROM reservation_pool
    WHERE product_id = $1
    LIMIT $2
    FOR UPDATE SKIP LOCKED
),
claimed AS (
    DELETE FROM reservation_pool rp
    USING candidate
    WHERE rp.product_id = $1
      AND rp.id = candidate.id
    RETURNING rp.id
),
reserved AS (
    INSERT INTO reserved_quantities (reservation_id, product_id, quantity)
    SELECT $3, $1, count(*)
    FROM claimed
    HAVING count(*) > 0
    RETURNING quantity
)
SELECT coalesce((SELECT quantity FROM reserved), 0)
When nothing can be claimed, the reservation refills the pool itself, as Shopify describes: one transaction at a time refills, and concurrent reservations wait for it. In PostgreSQL that lock is an advisory lock:
// replenish tops the pool up to p.Size units, moving them out of the
// inventory table. Only one transaction per product replenishes at a time;
// concurrent callers wait for it and then find the pool already refilled.
// It returns the number of units in the pool afterwards.
func (p Pool) replenish(ctx context.Context, db *sql.DB, productID int64) (int, error) {
	tx, err := db.BeginTx(ctx, nil)
	if err != nil {
		return 0, fmt.Errorf("beginning transaction: %w", err)
	}
	defer tx.Rollback()

	if _, err := tx.ExecContext(ctx, "SELECT pg_advisory_xact_lock($1)", productID); err != nil {
		return 0, fmt.Errorf("acquiring replenishment lock: %w", err)
	}

	// Counts units locked by in-flight reservations too: they are
	// either about to be reserved or about to be released.
	var inPool int
	if err := tx.QueryRowContext(ctx,
		"SELECT count(*) FROM reservation_pool WHERE product_id = $1",
		productID,
	).Scan(&inPool); err != nil {
		return 0, fmt.Errorf("counting pool: %w", err)
	}
	missing := p.Size - inPool
	if missing <= 0 {
		return inPool, tx.Commit()
	}

	// Move `missing` units (or whatever is left) out of the
	// inventory table and insert them into the pool.
	// ...
}
A deleted row has no newer version to follow, so problem 3 above shouldn’t happen here. It didn’t: zero Lock:transactionid waits at every concurrency level. But:
| Workers | Reservations/s | p50 | p99 | Top wait events (average backends) |
|---|---|---|---|---|
| 1 | 1,719 | 0.57 ms | 0.76 ms | IO:WalSync 1 |
| 50 | 9,978 | 2.91 ms | 44.28 ms | Lock:advisory 18, LWLock:WALWrite 15, LWLock:BufferContent 7 |
| 100 | 9,215 | 5.44 ms | 46.88 ms | LWLock:BufferContent 30, LWLock:WALWrite 28, Lock:advisory 13 |
| 500 | 7,340 | 15.74 ms | 206.91 ms | Lock:advisory 312, LWLock:BufferContent 85, LWLock:LockManager 50 |
| 1000 | 1,941 | 15.52 ms | 20,780.26 ms | Lock:advisory 821, LWLock:BufferContent 78, LWLock:LockManager 58 |
It holds 7,500–10,000 reservations per second from 10 to 500 workers, 2–4× the counter, with a p99 of 207 ms at 500. Then, at 1,000 workers, it collapses like strategy 2.
Small means hot
1,000 rows fit in a handful of pages, and every worker claims from them: problem 1 again, at a smaller scale (LWLock:BufferContent). And deleted rows are dead tuples until vacuum runs. The pool never held more than 1,000 live rows, yet it reached 277,000 dead tuples and 11 MB within a single run, so every claim also steps over dead rows (problem 2).
The refill lock becomes the queue
At 500 and 1,000 workers, most backends were waiting on Lock:advisory: the refill lock. With 1,000 workers and 1,000 units, every unit can be locked by an in-flight reservation at the same moment, so to everyone else the pool looks empty. They go to refill, queue on the lock, find the pool “full” (locked units still count) and go back to claiming. When the pool really does run dry, up to 1,000 workers line up behind the same lock, and each one takes it, counts the pool and leaves, one at a time.
A bigger pool helps but doesn’t fix it. At 1,000 workers:
| Pool size | Reservations/s | p50 | p99 |
|---|---|---|---|
| 1,000 | 2,084 | 14 ms | 19.2 s |
| 10,000 | 3,124 | 31 ms | 3.2 s |
Lock:advisory still dominated. A better refill policy (refilling before the pool runs dry, from a background process, with backoff) would help; my first attempt at one made things worse, because the serialized wait had been acting as a backoff. That’s a project of its own.
This says nothing bad about Shopify’s design in its own context. Their pools are per item and location, so their load is spread over many pools, and they don’t say how many concurrent checkouts a single pool sees. What it says is that one pool shared by every buyer of one item is itself a hot spot, and it has a limit. Here it held up to a few hundred concurrent buyers of a single item and couldn’t take 1,000.
Contention: the reservation pool’s pages, and its refill lock.
Strategy 4: making the workers not meet
Every strategy so far failed the same way: all workers going after the same few pages. So the last strategy attacks that directly. It’s strategy 2, with one product’s units split into 64 buckets of contiguous rows, each with its own pages:
CREATE TABLE IF NOT EXISTS bucketed_reservation_units (
    id             BIGSERIAL PRIMARY KEY,
    product_id     BIGINT NOT NULL,
    bucket         INTEGER NOT NULL,
    reservation_id UUID,
    reserved_at    TIMESTAMPTZ
);

CREATE INDEX IF NOT EXISTS idx_bucketed_reservation_units_available
ON bucketed_reservation_units (product_id, bucket, id)
WHERE reservation_id IS NULL;
// Ordering by bucket gives each bucket a contiguous range of ids,
// and therefore its own range of heap and index pages.
if _, err := db.ExecContext(ctx,
	`INSERT INTO bucketed_reservation_units (product_id, bucket)
	SELECT $1, g % $3::int
	FROM generate_series(1, $2::int) AS g
	ORDER BY g % $3::int, g`,
	productID, stock, s.Buckets,
); err != nil {
	return fmt.Errorf("inserting reservation units: %w", err)
}
Each reservation picks a random bucket and claims from it with the same SKIP LOCKED query plus AND bucket = $2, falling back to any bucket if that one has nothing claimable:
// reserveOne claims a single unit from a random bucket, falling back to any
// bucket when the chosen one has no unit that can be claimed right now.
// Each statement claims at most one unit, so no explicit transaction is needed.
func (s ShardedSkipLocked) reserveOne(ctx context.Context, db *sql.DB, productID int64) error {
	reservationID := uuid.New()
	var unitID int64
	err := db.QueryRowContext(ctx, claimBucketUnits, productID, rand.IntN(s.Buckets), reservationID, 1).Scan(&unitID)
	if errors.Is(err, sql.ErrNoRows) {
		err = db.QueryRowContext(ctx, claimAnyUnits, productID, reservationID, 1).Scan(&unitID)
	}
	if errors.Is(err, sql.ErrNoRows) {
		return ErrOutOfStock
	}
	return err
}
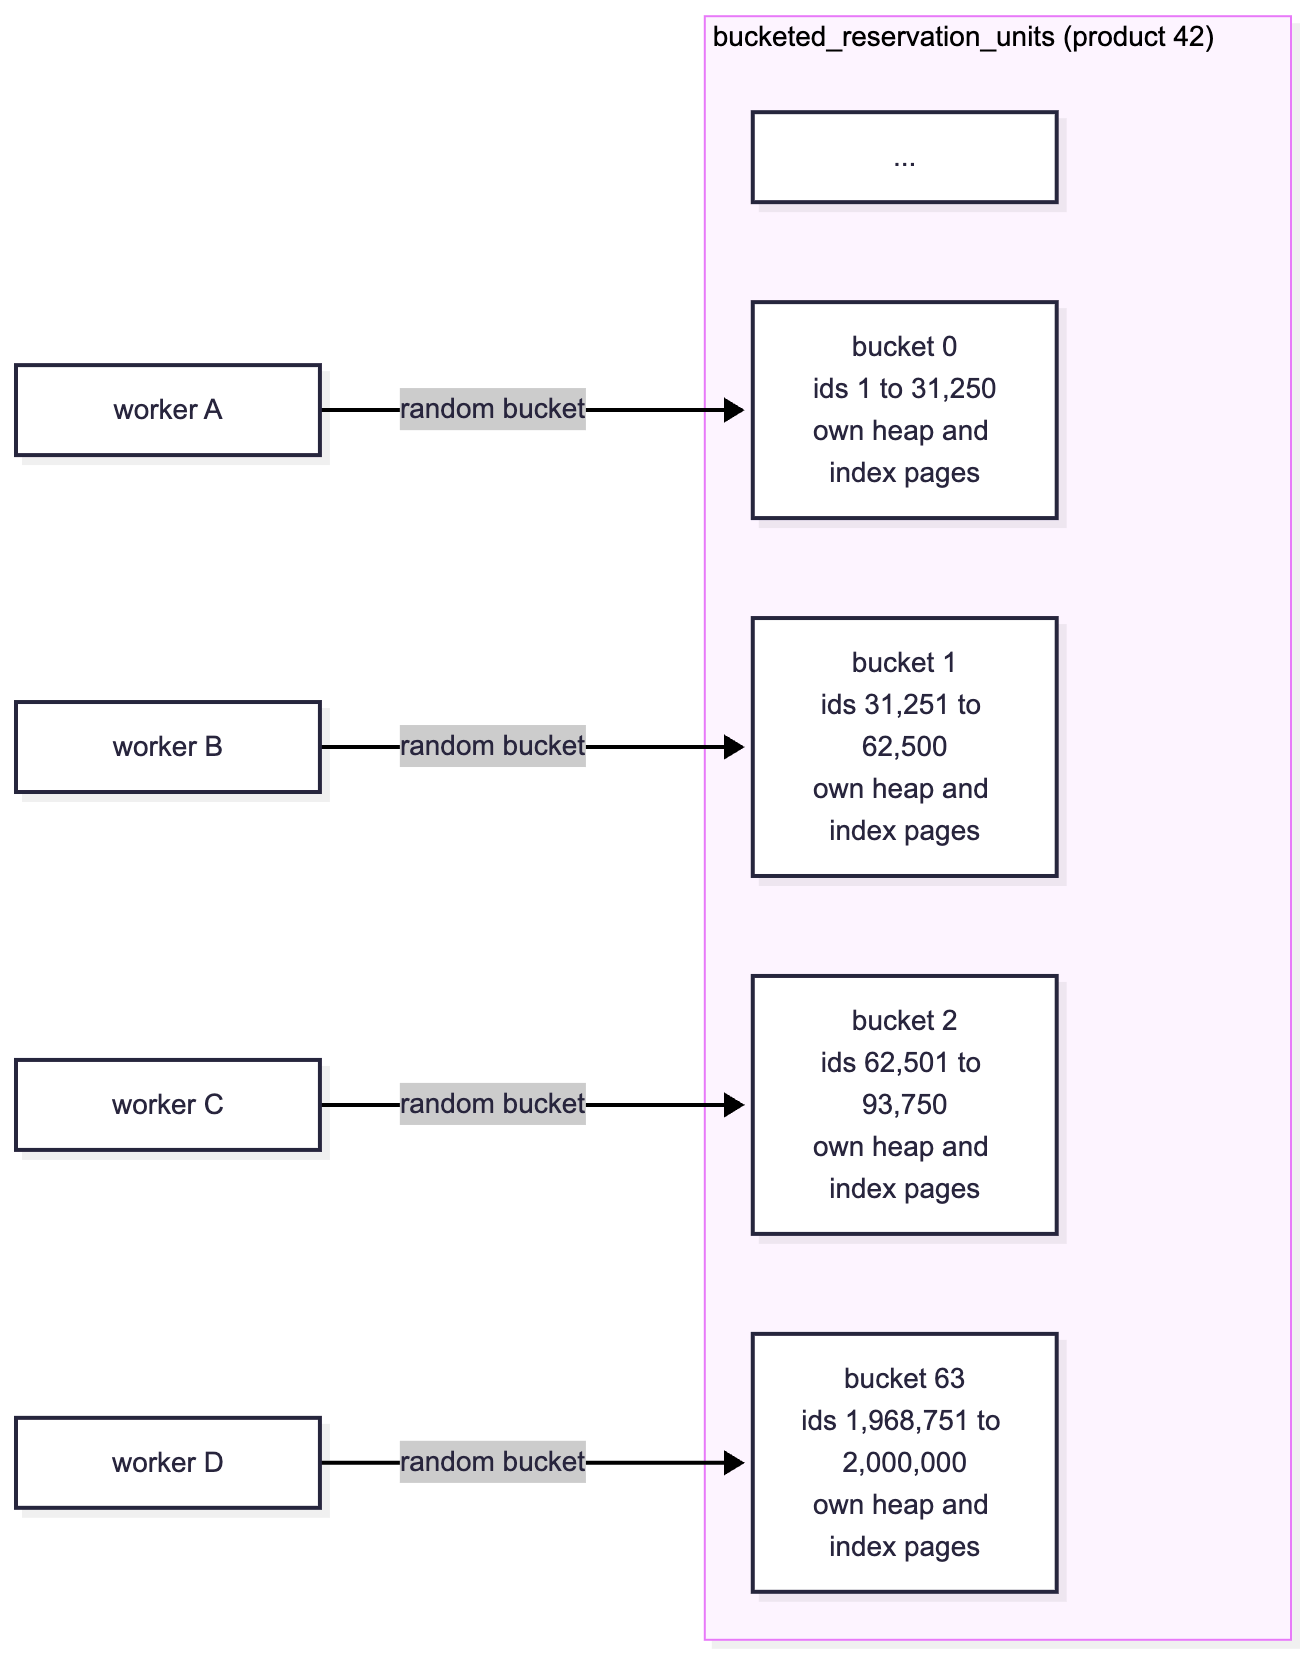
1,000 workers become about 16 per bucket, and each bucket accumulates 1/64 of the dead index entries. (The fallback matters: with SKIP LOCKED, an empty bucket and an out-of-stock product look the same from inside the bucket.)
| Workers | Reservations/s | p50 | p99 | Top wait events (average backends) |
|---|---|---|---|---|
| 1 | 2,236 | 0.45 ms | 0.71 ms | IO:WalSync 1 |
| 100 | 22,899 | 3.98 ms | 11.45 ms | LWLock:WALWrite 68, Client:ClientRead 10 |
| 250 | 22,486 | 9.63 ms | 36.41 ms | IPC:ProcarrayGroupUpdate 90, LWLock:WALWrite 72, LWLock:XactSLRU 45 |
| 500 | 20,461 | 18.92 ms | 102.78 ms | LWLock:WALWrite 197, IPC:ProcarrayGroupUpdate 127, LWLock:BufferContent 71 |
| 1000 | 17,069 | 38.95 ms | 317.15 ms | LWLock:WALWrite 308, IPC:ProcarrayGroupUpdate 234, LWLock:BufferContent 173 |
It keeps scaling to 100 workers, stays above 20,000 reservations per second up to 500, and at 1,000 workers it’s still at 17,069/s: 12× the counter at the same concurrency, with a p99 of 317 ms instead of 3.2 s.
Look at what’s left in the wait events: LWLock:WALWrite is writing WAL, IPC:ProcarrayGroupUpdate and LWLock:XactSLRU are recording that transactions committed. That’s the cost of committing over 20,000 transactions per second, not of fighting over the same data. There were no heavyweight lock waits at all up to 250 workers. At 1,000 workers, about 20 backends on average were back on Lock:transactionid: with 16 workers per bucket, problem 3 starts to show up again. More buckets would push it further out.
Contention: mostly gone. What’s left is the commit path.
All four, side by side
| Workers | counter | skip-locked | reservation pool | sharded |
|---|---|---|---|---|
| 1 | 2,599 | 2,118 | 1,719 | 2,236 |
| 10 | 5,216 | 9,453 | 7,496 | 11,876 |
| 25 | 4,226 | 11,593 | 7,503 | 14,074 |
| 50 | 3,558 | 10,651 | 9,978 | 21,216 |
| 100 | 3,107 | 7,209 | 9,215 | 22,899 |
| 250 | 2,670 | 3,051 | 8,450 | 22,486 |
| 500 | 1,857 | 1,859 | 7,340 | 20,461 |
| 1000 | 1,450 | 1,004 | 1,941 | 17,069 |
Reservations per second, 30-second runs. In the code, the strategies are counter, skip-locked, skip-locked-pool and skip-locked-sharded. The full table with p50/p95/p99/max for every run is in the repository.
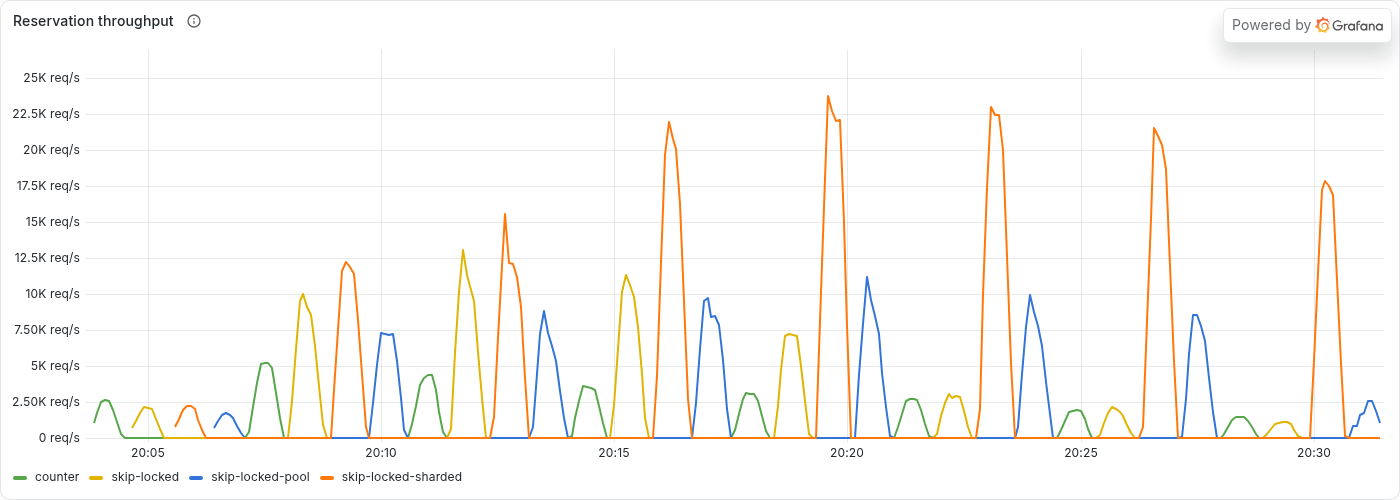
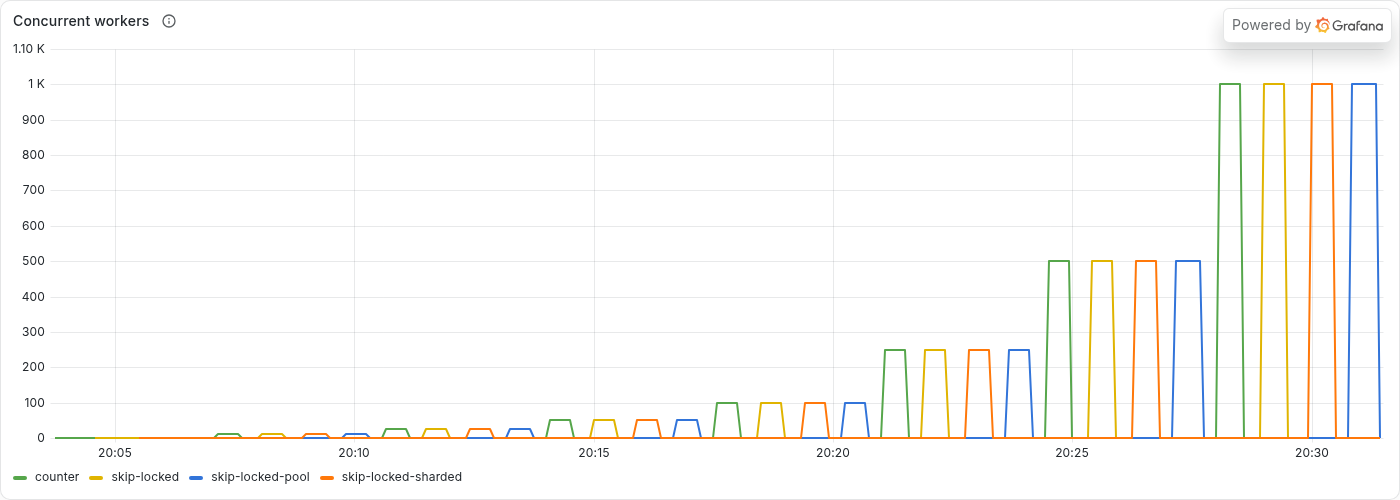
Each group of four peaks is one concurrency level, in the order counter (green), skip-locked (yellow), sharded (orange), reservation pool (blue). The workers panel shows which level is which:
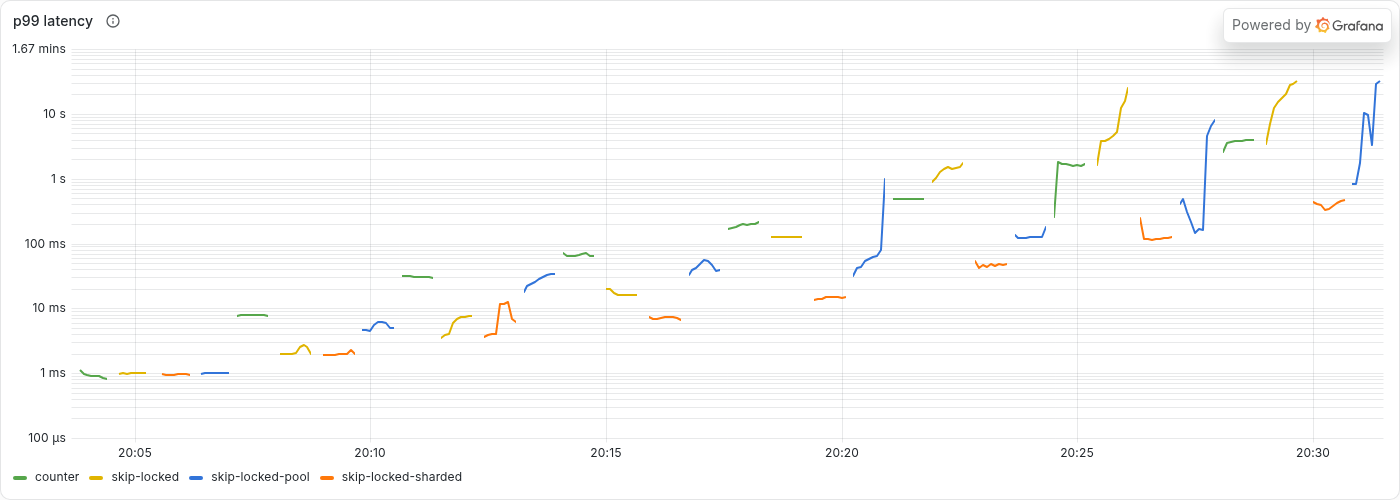
The p99 panel uses a log scale. The counter’s p99 grows steadily, the way a single queue does. The two strategies that collapse, skip-locked and the reservation pool, end with low medians (15–17 ms) and tails of around 20 seconds: most reservations get through, and the unlucky ones are stuck in a queue they weren’t supposed to be in.
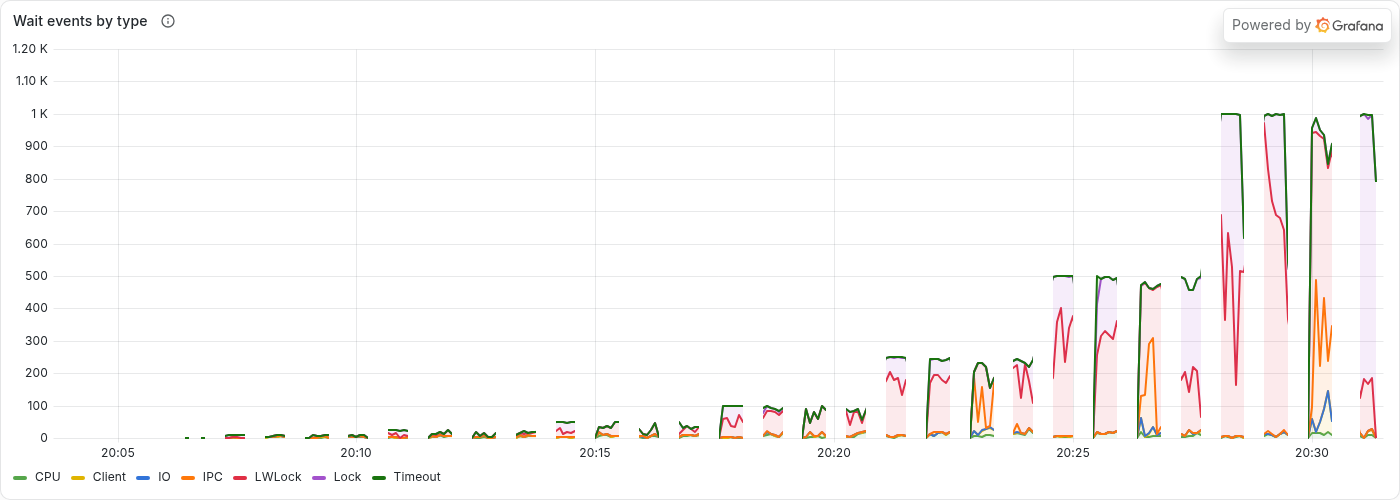
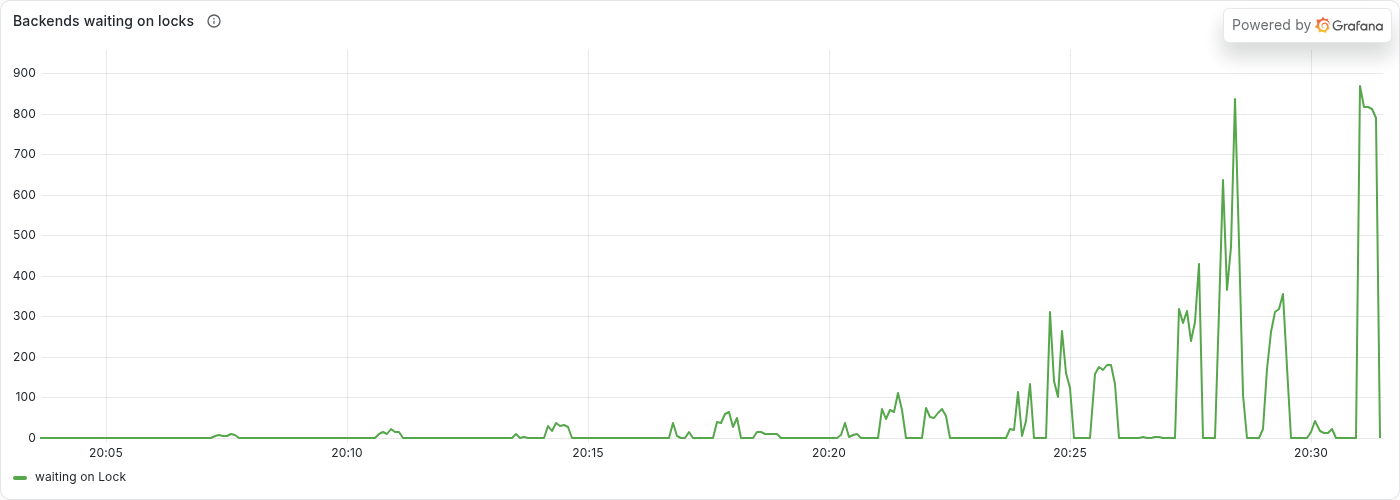
At one worker the counter wins, as it should: the other strategies do more work per reservation. It’s the only level where it does.
The price
Claiming rows instead of decrementing a number isn’t free.
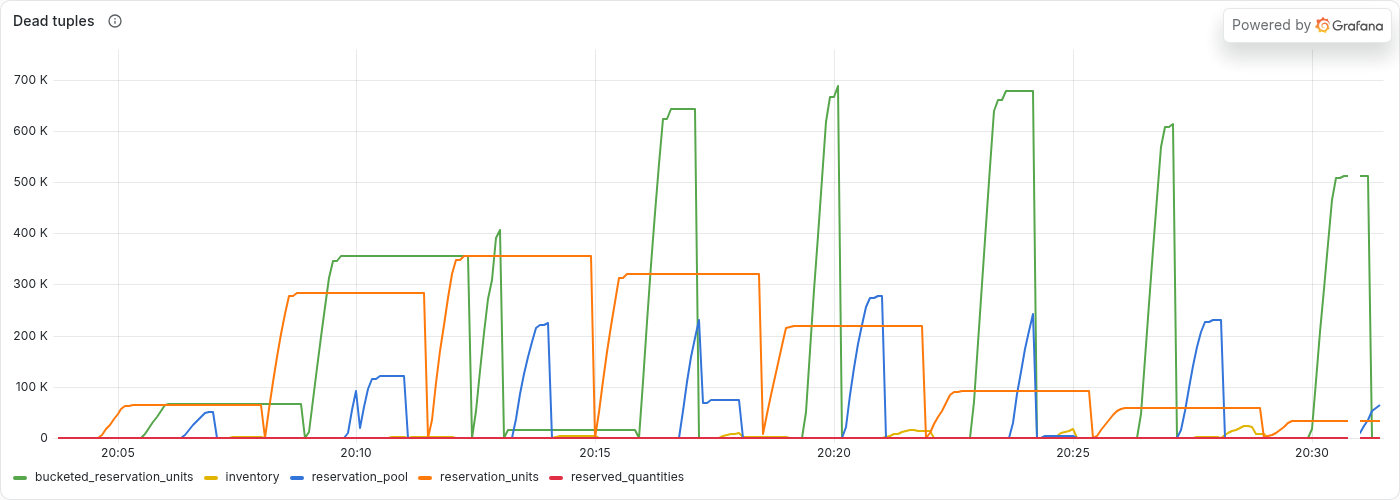
Every reservation is an UPDATE or a DELETE, and leaves a dead row version behind until vacuum removes it. The bucketed table accumulated up to 690,000 dead tuples in a single 30-second run. Those updates can’t be HOT either, because reservation_id appears in the partial index’s predicate, so each one also adds an entry to the primary key.
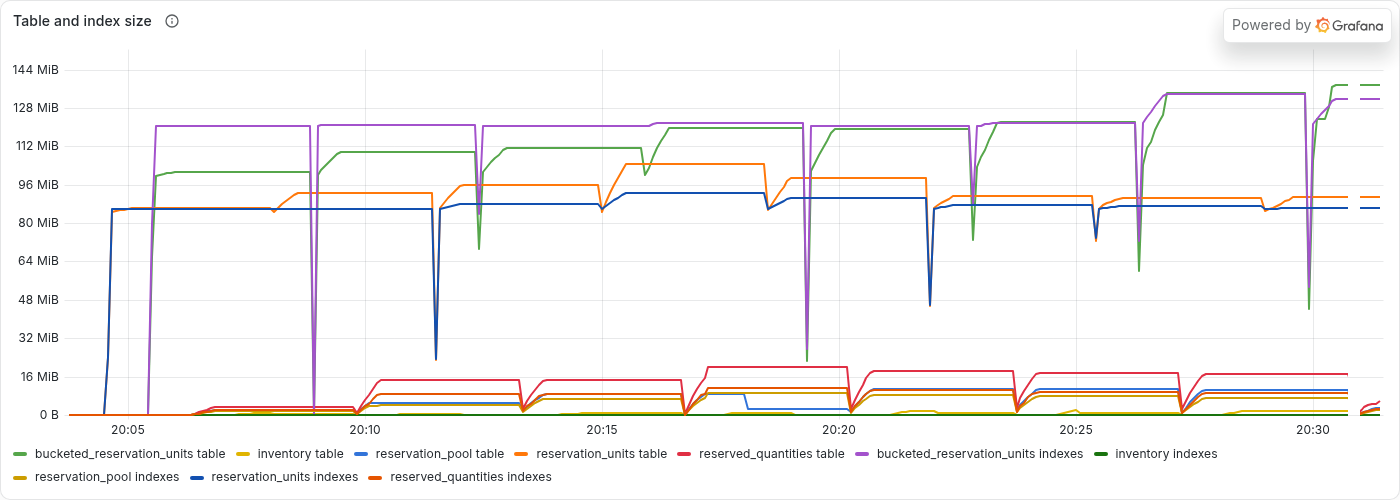
And WAL, measured strictly inside each run:
| Workers | Strategy | WAL/s | WAL per reservation |
|---|---|---|---|
| 100 | counter | 0.5 MB/s | ~150 B |
| 100 | skip-locked | 5.8 MB/s | ~805 B |
| 100 | reservation pool | 4.9 MB/s | ~535 B |
| 100 | sharded | 10.5 MB/s | ~460 B |
2–5× more WAL per reservation than the counter, and since the sharded strategy also does 7× more reservations per second, about 20× more WAL per second. All of it has to be archived, replicated and replayed by standbys.
We exchanged contention for write amplification. For the experiment, I materialized every unit of a 2-million-unit stock. In production I’d bound the number of claimable rows, as Shopify does, and spread them over enough buckets (or pools) that the workers don’t meet.
When to use what
Most of the time, use the counter. It was the fastest strategy at one worker and is by far the simplest. Here it handled about 5,000 reservations per second for one product before getting worse. If no product of yours gets near that, you’re done.
When one product gets a lot of concurrent demand (flash sales, ticket drops, limited slots, coupon codes), switch to claimable rows with SKIP LOCKED, and then:
- make sure workers don’t all start in the same place. A single
ORDER BY id LIMIT 1over one table, or one small pool per item, recreates the hot spot one level down. Buckets, random starting points, or several pools per hot item spread it out; - prefer deleting claimed rows over updating them if you can. It avoided the waits on other transactions completely, and if the claimed rows also live in separate buckets you get both benefits;
- check the plan with
EXPLAINon data shaped like production; - keep the transaction short: claim, record, commit. Row locks are held until commit; a payment call inside the transaction would hold units locked, invisible to everyone else, for its whole duration;
- watch wait events. They’re how every bottleneck in this article was found.
Everything here ran at PostgreSQL’s default READ COMMITTED isolation level. Under REPEATABLE READ or SERIALIZABLE, a concurrent update of the counter row fails with a serialization error instead of waiting, and the application has to retry. That’s a different benchmark.
Things that bit me along the way
A healthcheck that crashed PostgreSQL. At 1,000 workers, PostgreSQL restarted itself mid-run: untracked child process (PID 1332) exited with exit code 2, followed by crash recovery. That PID wasn’t a PostgreSQL process at all. In the official Docker image the postmaster is PID 1, so it adopts every orphaned process in the container. The Compose healthcheck runs pg_isready through sh -c with a 3-second timeout; under load it timed out, Docker killed the shell, and the orphaned pg_isready was adopted by the postmaster. When it exited with code 2 (“no response”), the postmaster treated it as a crashed child and restarted everything. The fix is one line, init: true on the service, so that a real init process is PID 1.
A laptop that went to sleep. One sweep ran on battery, the laptop slept in the middle of several runs, and the numbers looked like a new discovery. Plug in and run under caffeinate (on macOS).
A Grafana rate window. Grafana computes $__rate_interval from the data source’s scrape interval, which defaults to 15 seconds, giving a one-minute window that averaged each 30-second run with idle time. Setting timeInterval: 5s on the provisioned data source fixed the throughput panels.
Conclusion
A hot counter is easy to understand: many workers, one row, one queue. On this machine it peaked at 10 workers and got slower with every worker after that.
FOR UPDATE SKIP LOCKED is the standard way out, and it does stop transactions from waiting on each other’s rows. But in every version I tried where workers still converged on the same data (one table scanned from the start, or one small reservation pool per item), the contention just moved: to the first pages of a table, to dead row versions, to waits on other transactions, to a refill lock. Two of those versions ended up slower than the counter they replaced.
What scaled was making the workers not meet: 64 buckets of rows for one product, 17,000–23,000 reservations per second from 50 to 1,000 workers, with almost no lock waits left.
So the question isn’t “is SKIP LOCKED faster?” It’s “where did the contention go?”, and the wait events answer it every time.
The full project, including the dashboard and every result set, is available at https://github.com/tiagomelo/psql-scaling-inventory-reservations.