Observability in Go with Prometheus and Grafana: From Metrics to Dashboards

In my previous article, “Golang Out-of-the-Box Backpressure Handling Proven in Grafana”, I demonstrated how Grafana can help visualize gRPC backpressure metrics to understand system behavior under load.
This time, we’ll build a complete observability setup from scratch using:
- Go for the HTTP service and metric exposition,
- Prometheus for metrics scraping and storage,
- Grafana for visualization,
- and Vegeta for realistic load testing.
By the end, you’ll have a local environment where you can:
- Collect key HTTP metrics from a Go service,
- Visualize them in Grafana,
- Understand latency distributions, throughput, and in-flight load in real time.
Why observability matters
Monitoring tells you that something is wrong.
Observability helps you understand why.
In distributed systems, latency spikes, traffic bursts, or bottlenecks rarely happen in isolation. By exposing metrics directly from your Go services and visualizing them in Grafana, you gain visibility into:
- Request volume and trends
- Latency distribution over time
- Concurrency under load
This setup is simple enough for demos but realistic enough to extend into production.
Architecture Overview
The architecture consists of four containers managed by Docker Compose:
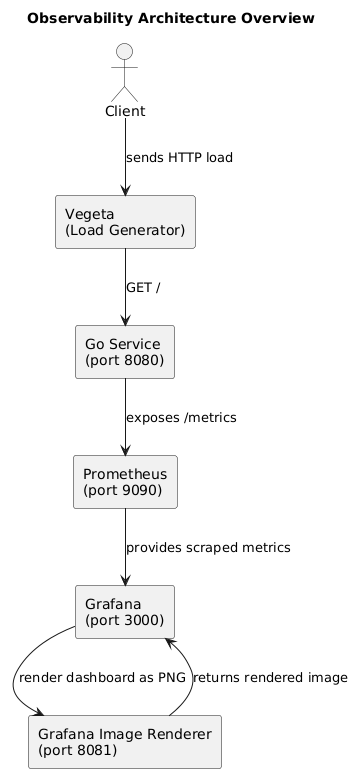
How Prometheus and Grafana interact
Before jumping into the Go code, let’s visualize how the pieces connect.
1. The Go service
Our Go application exposes two HTTP endpoints:
/– a simulated API route with random response times./metrics– a Prometheus exposition endpoint automatically generated by the Go client library.
Every incoming request updates three metrics:
- Total number of requests
- Request duration (histogram)
- Current in-flight requests (gauge)
These metrics are collected in memory and served at /metrics.
2. Prometheus
Prometheus runs a lightweight time-series database that periodically scrapes metrics from the Go service (every 5 seconds in our configuration).
Each metric is timestamped and stored, allowing historical queries such as:
rate(http_request_duration_seconds_sum[5m]) / rate(http_request_duration_seconds_count[5m])
This decouples metric collection from visualization, which is where Grafana comes in.
3. Grafana
Grafana queries Prometheus via HTTP and visualizes those metrics as interactive dashboards. It provides:
- Custom time ranges (
now-5m → now) - Auto-refresh intervals (5 s, 10 s, 30 s)
- Panel types (time series, gauge, bar chart)
The dashboards you’ll see next were automatically provisioned at container startup, meaning Grafana loads them on boot without any manual setup.
4. Renderer (optional)
The Grafana Image Renderer container allows Grafana to export dashboards as PNGs — useful for sharing snapshots in reports or CI pipelines.
From here, Prometheus continuously collects metrics, Grafana visualizes them, and Vegeta injects load to produce meaningful traffic data. With this foundation, we move into the actual Go implementation.
Go application
Our Go service simulates real HTTP traffic and exposes metrics for Prometheus. Here’s the complete code:
cmd/main.go
// Copyright (c) 2025 Tiago Melo. All rights reserved.
// Use of this source code is governed by the MIT License that can be found in
// the LICENSE file.

package main

import (
	"context"
	"log/slog"
	"math/rand"
	"net/http"
	"os"
	"os/signal"
	"syscall"
	"time"

	"github.com/pkg/errors"
	"github.com/prometheus/client_golang/prometheus"
	"github.com/prometheus/client_golang/prometheus/promhttp"
	promMetrics "github.com/tiagomelo/go-grafana-prometheus-example/prometheus"
)

func init() {
	// register Prometheus metrics.
	prometheus.MustRegister(promMetrics.HTTPRequestsMetric)
	prometheus.MustRegister(promMetrics.HTTPRequestDurationMetric)
	prometheus.MustRegister(promMetrics.HTTPInFlightRequestsMetric)
}

// handler is a sample HTTP handler.
func handler(w http.ResponseWriter, r *http.Request) {
	// update in-flight requests metric.
	promMetrics.HTTPInFlightRequestsMetric.Inc()
	defer promMetrics.HTTPInFlightRequestsMetric.Dec()

	start := time.Now()
	defer r.Body.Close()

	// simulate some work with random duration.
	time.Sleep(time.Duration(rand.Intn(500)) * time.Millisecond)

	// update http metrics counter metric.
	promMetrics.HTTPRequestsMetric.With(prometheus.Labels{"path": r.URL.Path}).Inc()

	// update http request duration metric.
	promMetrics.HTTPRequestDurationMetric.With(prometheus.Labels{"path": r.URL.Path}).Observe(time.Since(start).Seconds())

	w.WriteHeader(http.StatusNoContent)
}

// run starts the main application logic.
func run(log *slog.Logger) error {
	const port = ":8080"
	ctx := context.Background()
	defer log.InfoContext(ctx, "completed")

	log.InfoContext(ctx, "starting server", slog.String("port", port))

	// mux for HTTP routes.
	mux := http.NewServeMux()
	mux.HandleFunc("/", handler)
	mux.Handle("/metrics", promhttp.Handler())

	srv := &http.Server{
		Addr:    port,
		Handler: mux,
	}

	// channel to capture OS signals.
	shutdown := make(chan os.Signal, 1)
	signal.Notify(shutdown, os.Interrupt, syscall.SIGTERM)

	// channel to capture server errors.
	serverErrors := make(chan error, 1)

	go func() {
		serverErrors <- srv.ListenAndServe()
	}()

	// blocking main and waiting for shutdown.
	select {
	case err := <-serverErrors:
		return errors.Wrap(err, "server error")
	case sig := <-shutdown:
		log.InfoContext(ctx, "shutting down", slog.String("signal", sig.String()))

		shutdownCtx, cancel := context.WithTimeout(ctx, 5*time.Second)
		defer cancel()
		if err := srv.Shutdown(shutdownCtx); err != nil {
			return errors.Wrap(err, "could not stop server gracefully")
		}
	}

	return nil
}

func main() {
	log := slog.New(slog.NewTextHandler(os.Stdout, nil))
	if err := run(log); err != nil {
		log.Error("error", slog.Any("err", err))
		os.Exit(1)
	}
}
Prometheus metrics definition
prometheus/prometheus.go
// Copyright (c) 2025 Tiago Melo. All rights reserved.
// Use of this source code is governed by the MIT License that can be found in
// the LICENSE file.

package prometheus

import "github.com/prometheus/client_golang/prometheus"

var (
	// HTTPRequestsMetric counts the number of HTTP requests received.
	HTTPRequestsMetric = prometheus.NewCounterVec(
		prometheus.CounterOpts{
			Name: "http_requests_total",
			Help: "Number of http requests",
		},
		[]string{"path"},
	)
	// HTTPInFlightRequestsMetric tracks the number of concurrent in-flight HTTP requests.
	HTTPInFlightRequestsMetric = prometheus.NewGauge(
		prometheus.GaugeOpts{
			Name: "http_in_flight_requests",
			Help: "Current number of in-flight HTTP requests being served.",
		},
	)
	// HTTPRequestDurationMetric measures the duration of HTTP requests.
	HTTPRequestDurationMetric = prometheus.NewHistogramVec(
		prometheus.HistogramOpts{
			Name:    "http_request_duration_seconds",
			Help:    "Duration of HTTP requests",
			Buckets: prometheus.LinearBuckets(0.1, 0.1, 10),
		},
		[]string{"path"},
	)
)
Metrics explained
| Metric | Type | Description |
|---|---|---|
http_requests_total |
Counter | Increments every time a request is processed |
http_request_duration_seconds |
Histogram | Tracks request latency in seconds |
http_in_flight_requests |
Gauge | Number of concurrent requests being served |
The in-flight gauge complements the counter and histogram by showing concurrency — a key part of backpressure detection and capacity planning.
Prometheus configuration
prometheus/config/prometheus.yaml
scrape_configs:
  # 'job_name' labels the metrics collected from this service.
  - job_name: 'go_app'
    # Scrape interval defines how often Prometheus pulls metrics.
    scrape_interval: 5s
    # The target is our Go service container (resolved via Docker DNS).
    static_configs:
      - targets: ['go_app:8080']
Grafana provisioning
provisioning/datasources/datasources.yaml
apiVersion: 1

datasources:
- name: Prometheus
  type: prometheus
  url: http://prometheus:9090
  access: proxy
  isDefault: true
provisioning/dashboards/dashboards.yaml
apiVersion: 1

providers:
- name: 'default'
  orgId: 1
  folder: ''
  type: file
  disableDeletion: false
  updateIntervalSeconds: 30 # how often Grafana will scan for changed dashboards.
  options:
    path: /etc/grafana/provisioning/dashboards
Dashboards are provisioned automatically:
avg-request-duration-over-time.jsonmax-request-duration-over-time.jsonhttp-requests-over-time.jsonin-flight-http-requests.jsonapi-dashboard.json(the consolidated view)
Docker Compose
services:
  go_app:
    build: .
    container_name: go_app
    ports:
      - "8080:8080"
    networks:
      - monitoring_network

  grafana:
    image: grafana/grafana:latest
    ports:
      - 3000:3000
    env_file:
      - .env
    volumes:
      - grafana_data:/var/lib/grafana
      - ./provisioning/dashboards:/etc/grafana/provisioning/dashboards
      - ./provisioning/datasources:/etc/grafana/provisioning/datasources
    networks:
      - monitoring_network
    depends_on:
      - renderer

  prometheus:
    image: prom/prometheus:latest
    volumes:
      - ./prometheus/config:/etc/prometheus
      - prometheus_data:/prometheus
    command:
      - --config.file=/etc/prometheus/prometheus.yaml
    ports:
      - 9090:9090
    networks:
      - monitoring_network

  renderer:
    image: grafana/grafana-image-renderer:latest
    expose:
      - 8081
    networks:
      - monitoring_network
    restart: on-failure

networks:
  monitoring_network:

volumes:
  grafana_data:
  prometheus_data:
Dockerfile for our API
FROM golang:1.25-alpine AS builder

WORKDIR /app
COPY . .

# Build binary statically (small, fast).
RUN go build -o server ./cmd/main.go

# ---
FROM alpine:3.20

WORKDIR /app
COPY --from=builder /app/server .

EXPOSE 8080

CMD ["./server"]
Enabling dashboard export to PNG
Grafana can render dashboards and panels as static PNG images, which is especially useful for embedding visualizations in reports or CI pipelines.
We enable this capability through the Grafana Image Renderer container and the following environment variables in the .env file:
GF_RENDERING_SERVER_URL=http://renderer:8081/render
GF_RENDERING_CALLBACK_URL=http://grafana:3000/
GF_RENDERING_SERVER_ENABLED=true
GF_LOG_FILTERS=rendering:debug
- GF_RENDERING_SERVER_URL – Points Grafana to the image renderer service.
- GF_RENDERING_CALLBACK_URL – Informs the renderer how to reach Grafana internally.
- GF_RENDERING_SERVER_ENABLED – Turns on image rendering.
- GF_LOG_FILTERS – Enables debug logging for render operations.
The renderer service is defined in docker-compose.yaml:
  renderer:
    image: grafana/grafana-image-renderer:latest
    expose:
      - 8081
    networks:
      - monitoring_network
    restart: on-failure
Since both Grafana and the renderer share the same internal Docker network, Grafana can render panels directly using internal requests—no external port exposure is necessary.
You can export a rendered image from the UI via:
- select the dashboard, click in the
...menu at the top right corner and selectShare -> Share link
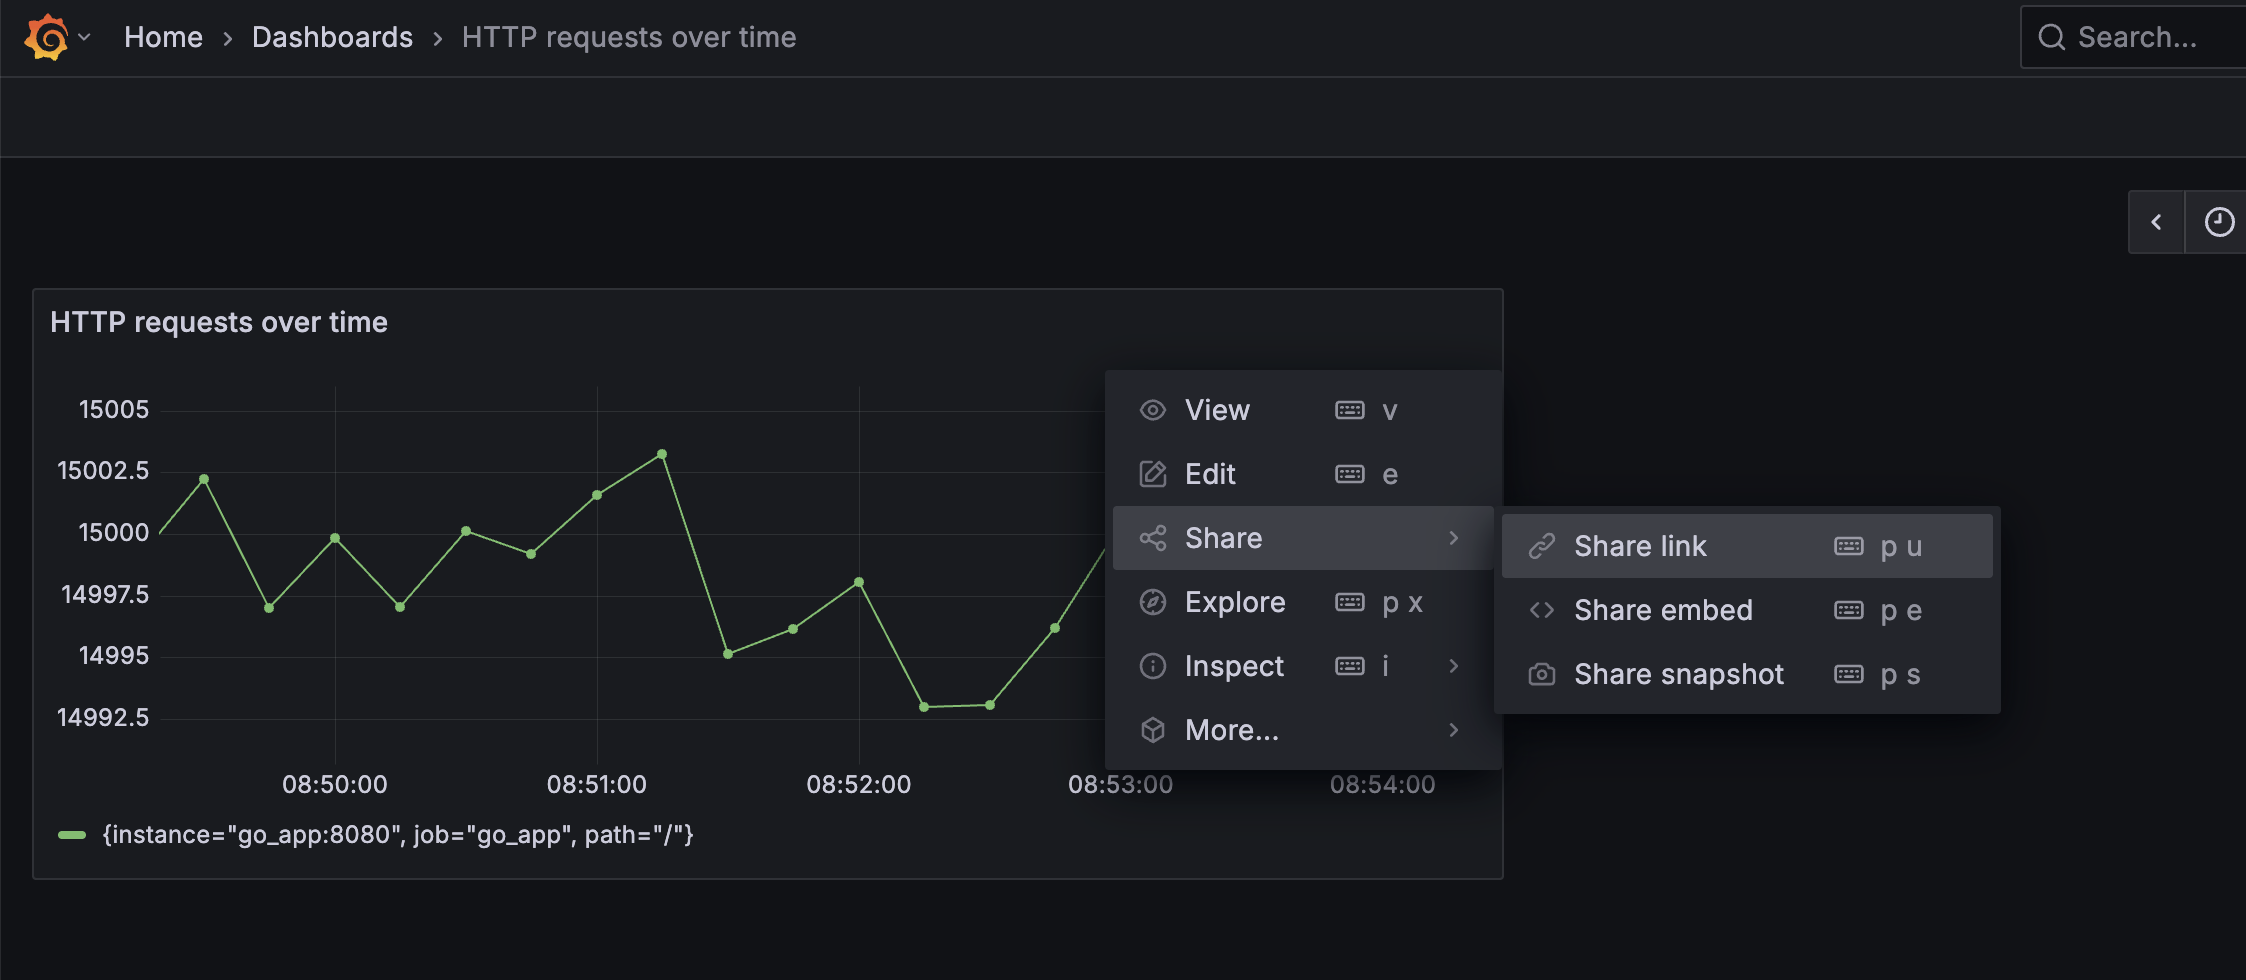
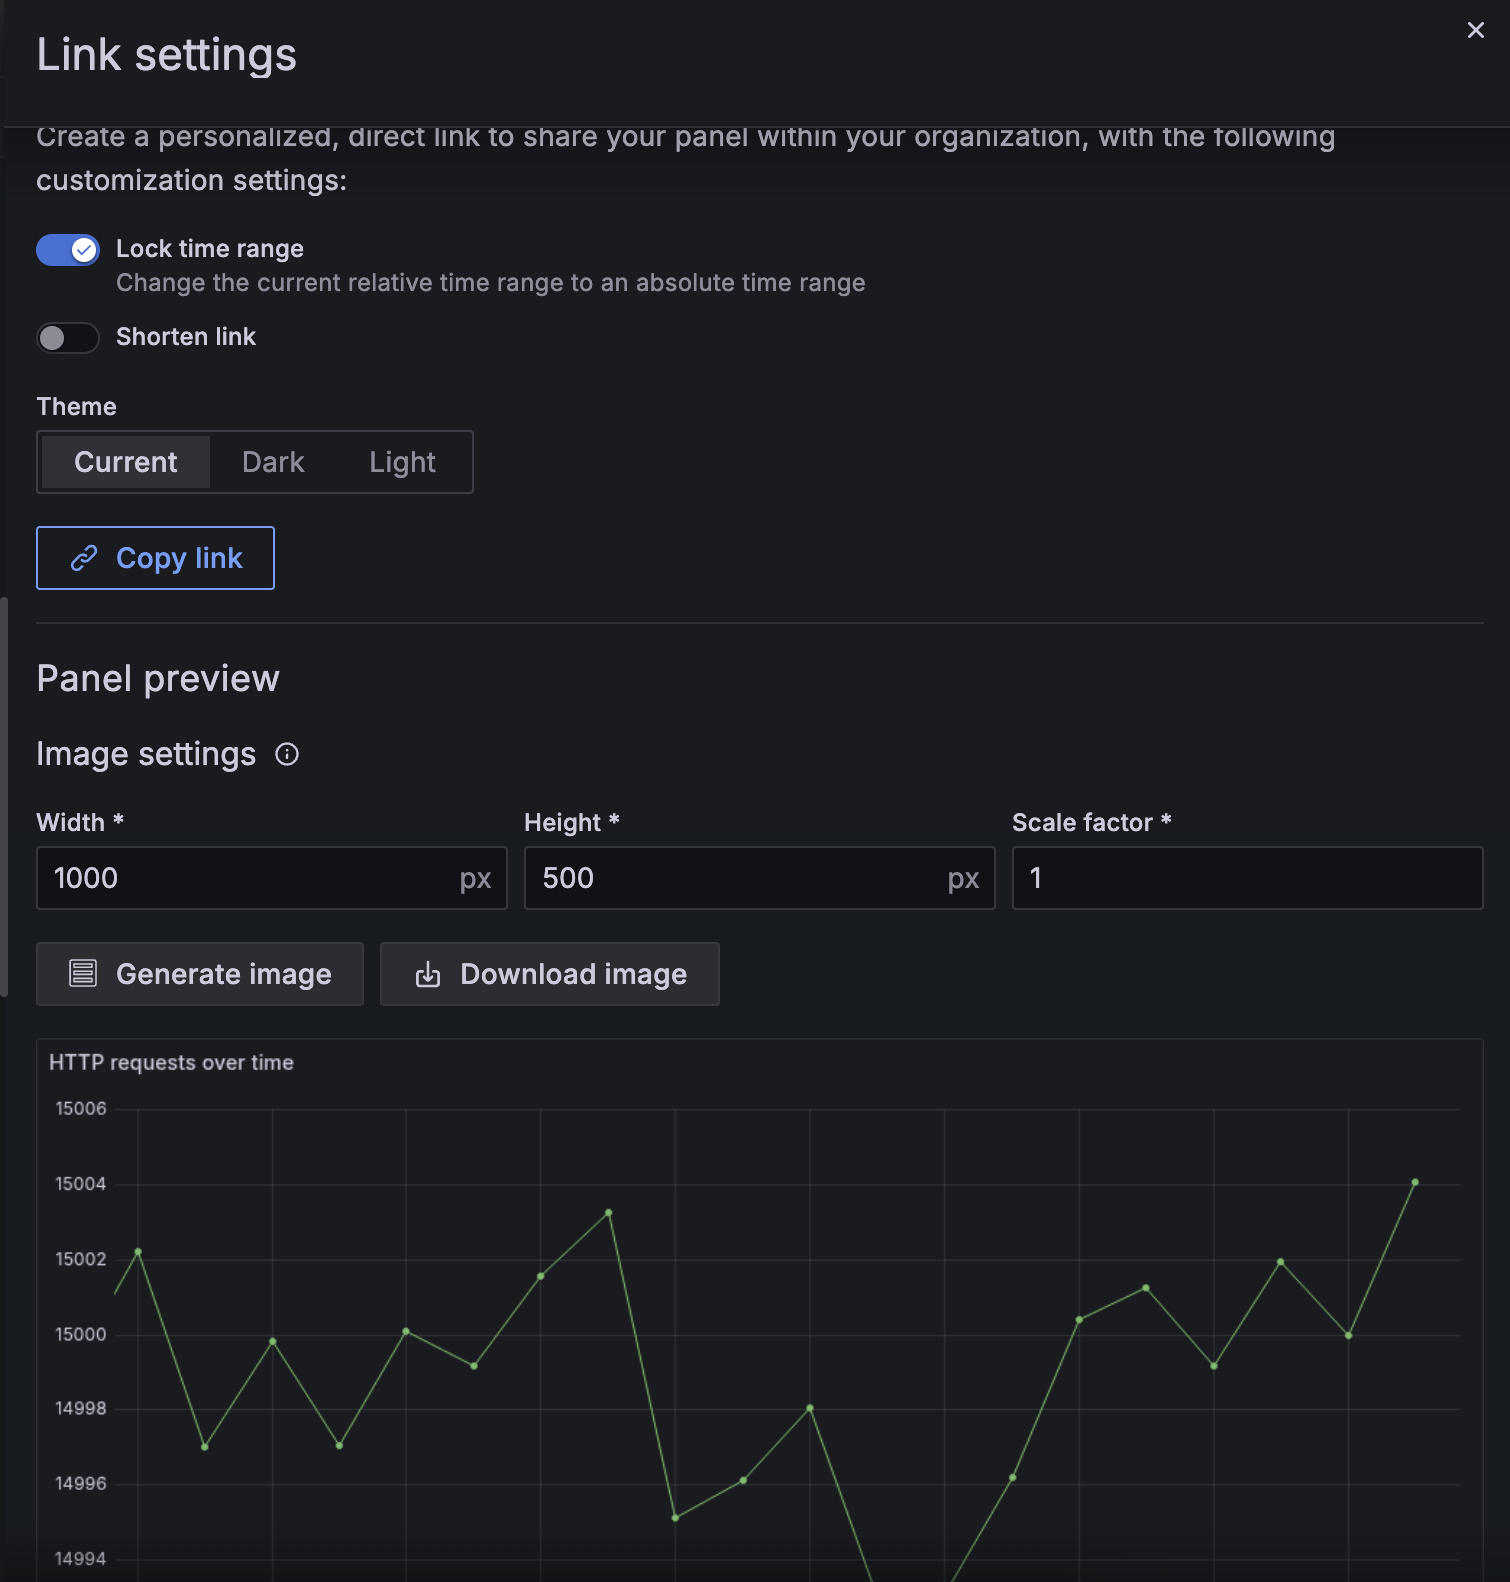
- click in
Generate imagebutton, and then click inDownload imagebutton
Building and running
Makefile
.PHONY: help
## help: shows this help message
help:
	@ echo "Usage: make [target]\n"
	@ sed -n 's/^##//p' ${MAKEFILE_LIST} | column -t -s ':' |  sed -e 's/^/ /'

.PHONY: run
## run: runs the http server
run:
	@ docker-compose up --build -d

.PHONY: stop
## stop: stops the http server
stop:
	@ docker-compose down -v

.PHONY: load-test
## load-test: runs a load test against the http server
load-test: run
	@ echo "GET http://localhost:8080/" | vegeta attack -rate=50/s | vegeta report -every=1s
Run everything:
make run
Grafana: http://localhost:3000
The credentials will be the ones we’ve defined in our .env file:
GF_SECURITY_ADMIN_USER=admin
GF_SECURITY_ADMIN_PASSWORD=admin123
Building the consolidated dashboard
To build the api-dashboard.json, I reused the process described in my previous article “Golang Out-of-the-Box Backpressure Handling Proven in Grafana”, where I showed how to export panels as JSON models.
Each individual dashboard (e.g., “Average Request Duration”, “Max Request Duration”, etc.) was exported and merged into one API Overview Dashboard.
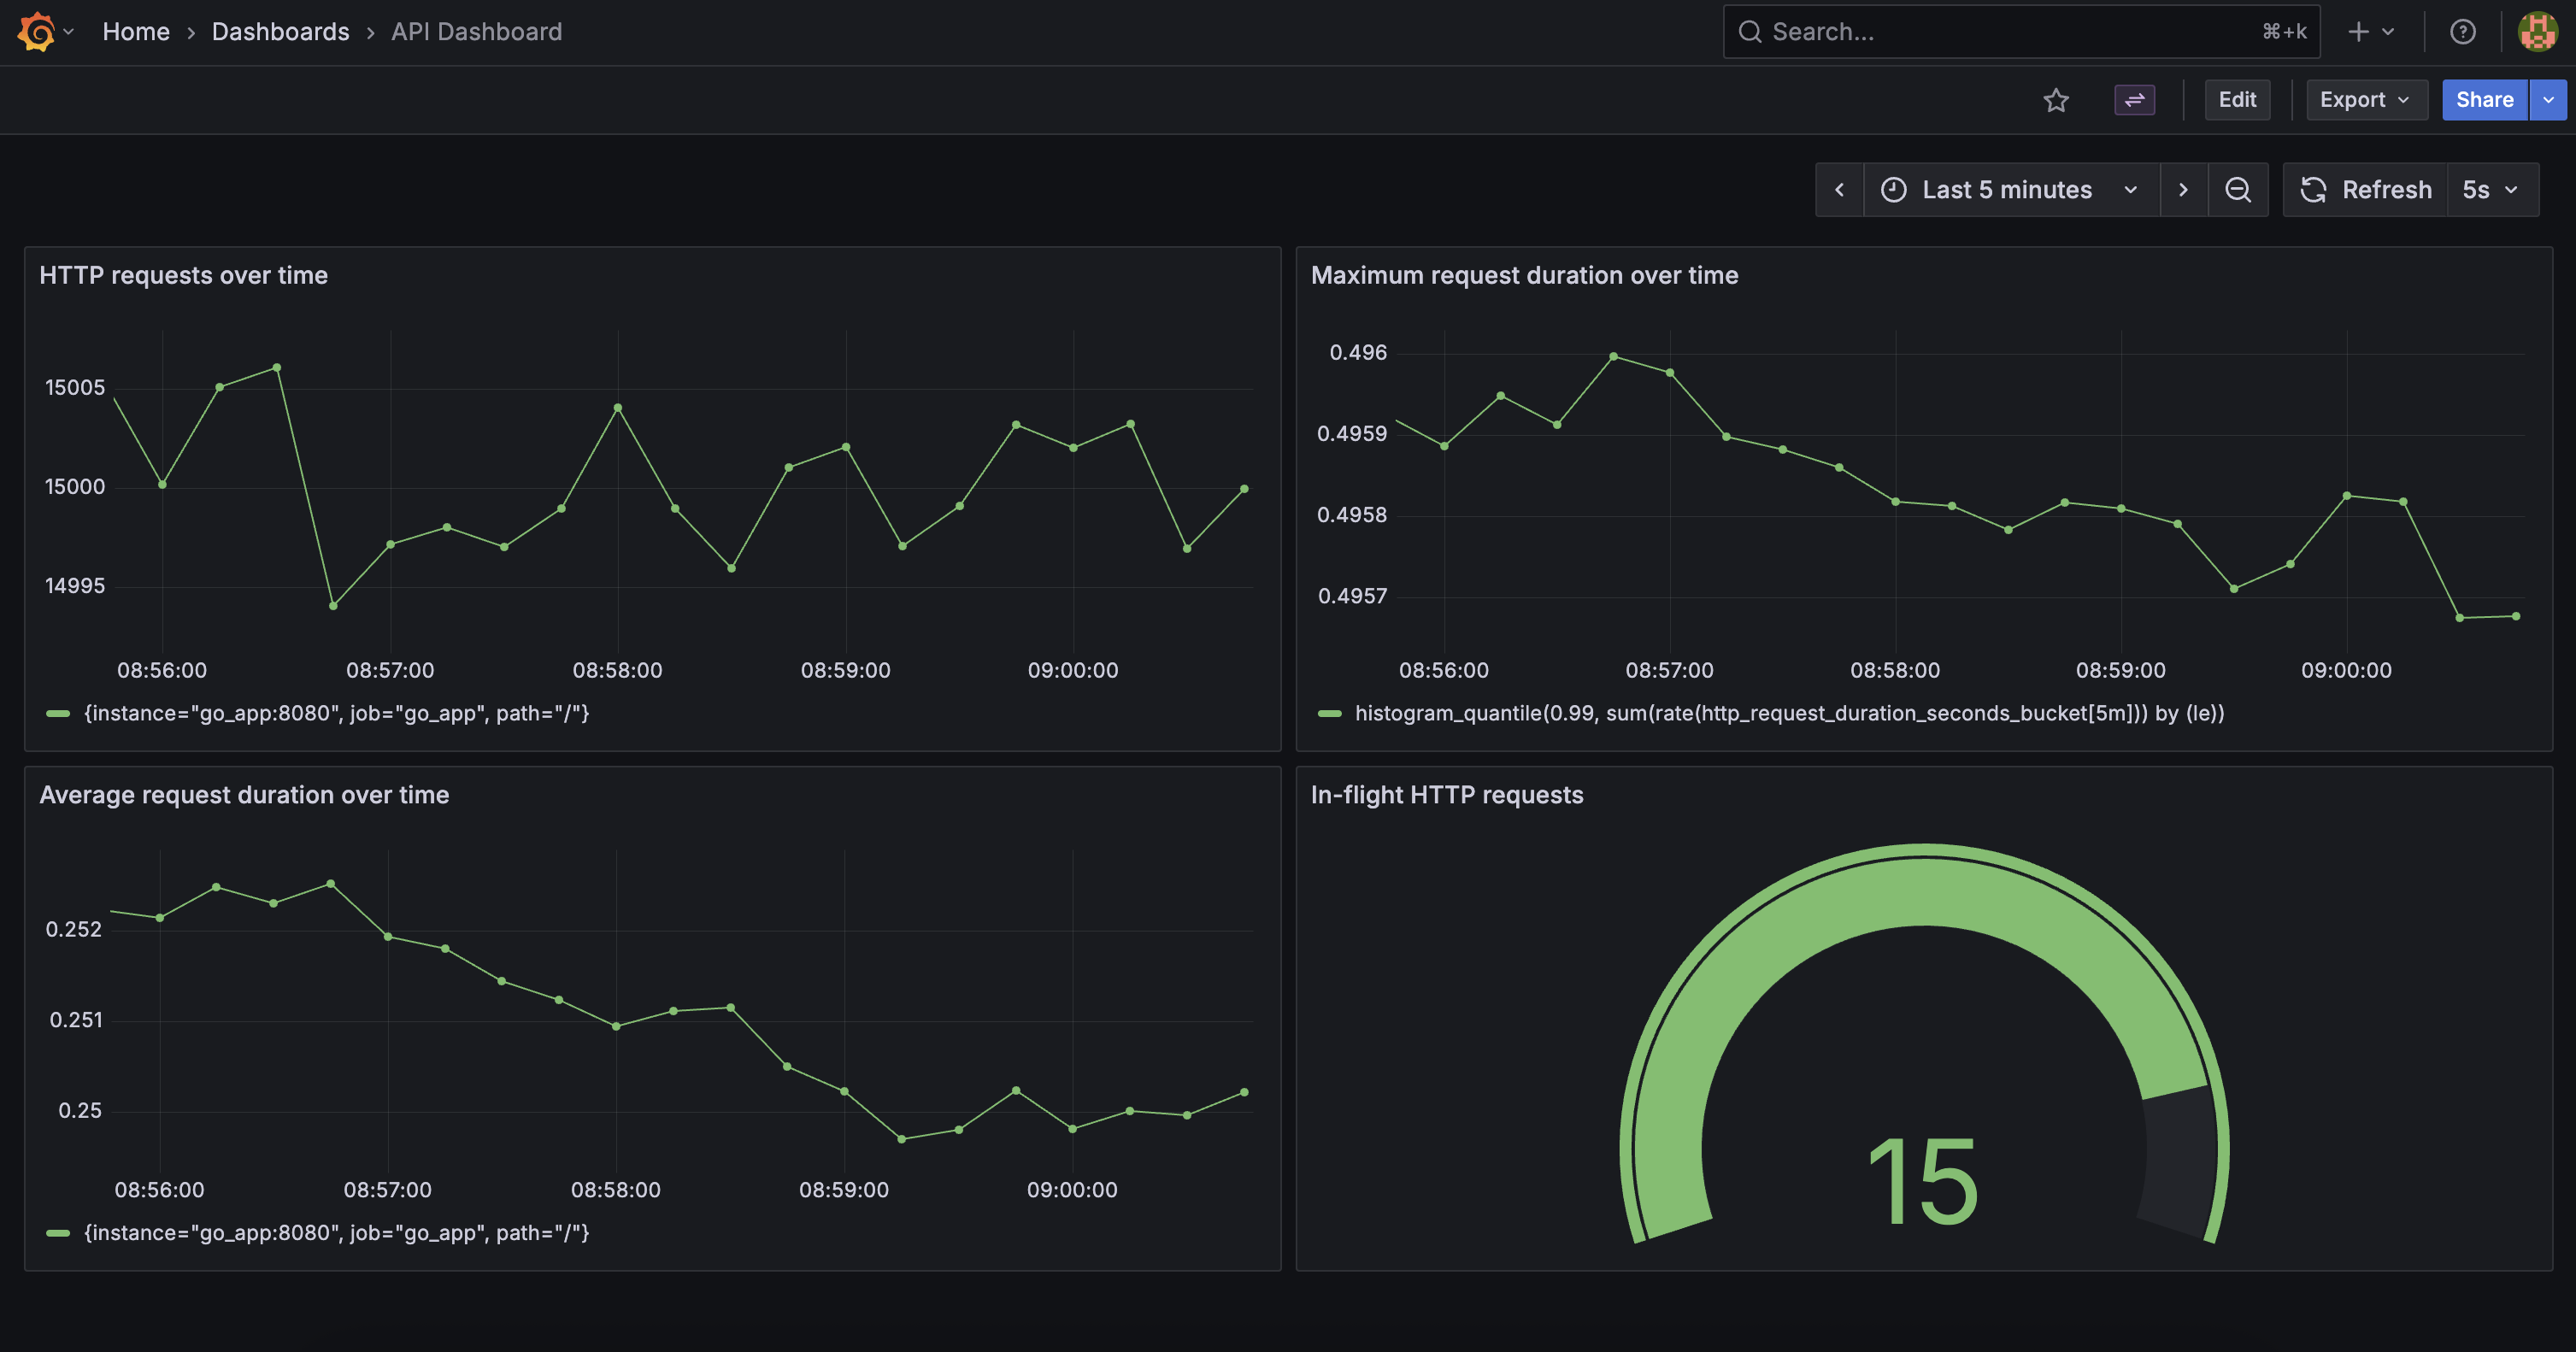
This manual export process is necessary because Grafana does not yet support provisioning library panels, as noted in issue #46247.
Running a load test
make load-test
Then watch metrics update in real time:
- Average Request Duration
- Max Request Duration
- Number of HTTP requests
- In-flight requests gauge
Final Thoughts
This small stack demonstrates how to go from instrumentation to visualization:
- The Go service exposes Prometheus metrics using the official client library.
- Prometheus scrapes those metrics at a fixed interval.
- Grafana visualizes latency, throughput, and concurrency.
- Vegeta drives load, simulating real-world scenarios.
From here, you can extend this setup with:
- Custom application metrics (database latency, queue depth, etc.)
- Alertmanager integration
- Grafana annotations for deployments
References & Further Reading
- Prometheus Go client library
- Grafana provisioning documentation
- Grafana issue #46247 – Library panels provisioning
- Grafana Image Renderer docs
- Vegeta load testing tool
- Your previous Grafana article
GitHub Repository Here: https://github.com/tiagomelo/go-grafana-prometheus-example