Understanding Postgres Exporter - monitoring PostgreSQL the Prometheus way

In a previous article, we saw how create a complete observability setup. Now let’s see a concrete example.
When you want to know what your PostgreSQL instance is doing — how many transactions it’s handling, how often it checkpoints, or how full its cache is — you don’t have to query pg_stat_* views manually.
That’s what postgres_exporter does for you. It turns PostgreSQL’s internal statistics into Prometheus metrics, ready to be scraped and visualized in Grafana.
In this article, we’ll:
- Set up
postgres_exporterwith Docker Compose, - Feed it activity using
pgbench, - Watch the metrics come alive in Grafana.
what is Postgres Exporter?
postgres_exporter is part of the prometheus-community project.
It runs alongside your database and exposes metrics via HTTP (default port 9187) in Prometheus format.
Under the hood, it:
- Connects to PostgreSQL using a read-only user.
-
Periodically runs queries against PostgreSQL’s internal statistics views, such as:
pg_stat_databasepg_stat_bgwriterpg_stat_activitypg_statio_user_tables
- Converts the results into numeric time-series metrics with descriptive labels.
Each metric comes prefixed with pg_ — for example:
pg_stat_database_xact_commit{datname="example"} 12735
pg_stat_bgwriter_buffers_backend_fsync 4
pg_up 1
These metrics can then be scraped by Prometheus, visualized in Grafana, or used in alert rules.
example: deploying Postgres Exporter
docker-compose.yaml:
services:
  psql_grafana_db:
    image: postgres:17
    container_name: ${POSTGRES_DATABASE_CONTAINER_NAME}
    restart: always
    env_file:
      - .env
    ports:
      - "5432:5432"
    volumes:
      - psql_grafana_db_data:/var/lib/postgresql/data
    networks:
      - psqldb-network

  postgres_exporter:
    image: quay.io/prometheuscommunity/postgres-exporter
    container_name: postgres_exporter
    environment:
      DATA_SOURCE_URI: "psql_grafana_db:5432/postgres?sslmode=disable"
      DATA_SOURCE_USER: "${POSTGRES_USER}"
      DATA_SOURCE_PASS: "${POSTGRES_PASSWORD}"
    ports:
      - "9187:9187"
    networks:
      - psqldb-network
    depends_on:
      - psql_grafana_db
    restart: always

  renderer:
    image: grafana/grafana-image-renderer:latest
    expose:
      - 8081
    networks:
      - psqldb-network
    restart: on-failure

  grafana:
    image: grafana/grafana:latest
    ports:
      - 3000:3000
    env_file:
      - .env
    volumes:
      - grafana_data:/var/lib/grafana
      - ./provisioning/dashboards:/etc/grafana/provisioning/dashboards
      - ./provisioning/datasources:/etc/grafana/provisioning/datasources
    networks:
      - psqldb-network
    depends_on:
      - renderer

  prometheus:
    image: prom/prometheus:latest
    container_name: prometheus
    volumes:
      - ./prometheus.yml:/etc/prometheus/prometheus.yml:ro
    ports:
      - "9090:9090"
    networks:
      - psqldb-network
    depends_on:
      - postgres_exporter
    restart: on-failure

networks:
  psqldb-network:
    driver: bridge

volumes:
  grafana_data:
  psql_grafana_db_data:
This configuration makes the exporter connect to our PostgreSQL container (psql_grafana_db) and expose its metrics at:
http://localhost:9187/metrics
Open that URL in your browser and you’ll see hundreds of raw metrics in Prometheus format.
what kinds of metrics does it expose?
The exporter organizes metrics in logical groups, matching PostgreSQL’s own stats views.
database-level stats
pg_stat_database_xact_commit/pg_stat_database_xact_rollbackpg_stat_database_blks_read/pg_stat_database_blks_hitpg_stat_database_tup_returned,pg_stat_database_tup_fetched
These are great for understanding workload intensity and cache efficiency.
background writer
pg_stat_bgwriter_buffers_backend_fsyncpg_stat_bgwriter_checkpoints_timedpg_stat_bgwriter_buffers_alloc
These describe how often PostgreSQL flushes dirty buffers and performs checkpoints — key for I/O analysis.
connections
pg_stat_activity_countpg_stat_activity_max_tx_durationpg_up(exporter health metric)
These tell you how many sessions are active and if the exporter can reach the database.
table I/O
pg_statio_user_tables_idx_blks_readpg_statio_user_tables_heap_blks_hit
Useful for detecting tables that don’t fit well in memory.
Prometheus Scraping Configuration
prometheus.yml:
scrape_configs:
  - job_name: 'postgres'
    scrape_interval: 10s
    static_configs:
      - targets: ['postgres_exporter:9187']
Prometheus pulls metrics from postgres_exporter every 10 seconds.
Grafana dashboards
Grafana doesn’t know about PostgreSQL metrics by default, but the community has already done the hard work. You can import ready-made dashboards from grafana.com/grafana/dashboards:
After downloading the JSON files, make these quick edits:
"datasource": "Prometheus",
"refresh": "5s",
"time": { "from": "now-5m", "to": "now" }
Then drop them into provisioning/dashboards/ — Grafana will auto-load them.
Example provisioning snippet:
apiVersion: 1

providers:
- name: 'default'
  orgId: 1
  folder: ''
  type: file
  disableDeletion: false
  updateIntervalSeconds: 30 # how often Grafana will scan for changed dashboards.
  options:
    path: /etc/grafana/provisioning/dashboards
Once Grafana is running, visit http://localhost:3000
(login: admin / admin123) and you’ll see dashboards light up as soon as data starts flowing.
Generating activity with pgbench
To make the exporter’s metrics interesting, we need some workload.
pgbench — PostgreSQL’s built-in benchmarking tool — is perfect for that.
We’re not measuring performance here, just producing enough transactions to keep stats moving.
The Makefile automates it all:
- start PostgreSQL and monitoring stack
make start-monitoring
- run the benchmark
make run-benchmark
which executes something equivalent to:
pgbench -h localhost -p 5432 -U postgres -c 10 -j 3 -T 999999999 example
Let it run, open Grafana, and watch metrics like:
pg_stat_database_xact_commitpg_stat_bgwriter_checkpoints_timedpg_stat_database_blks_hitcontinuously increase as pgbench clients issue transactions.
example dashboards
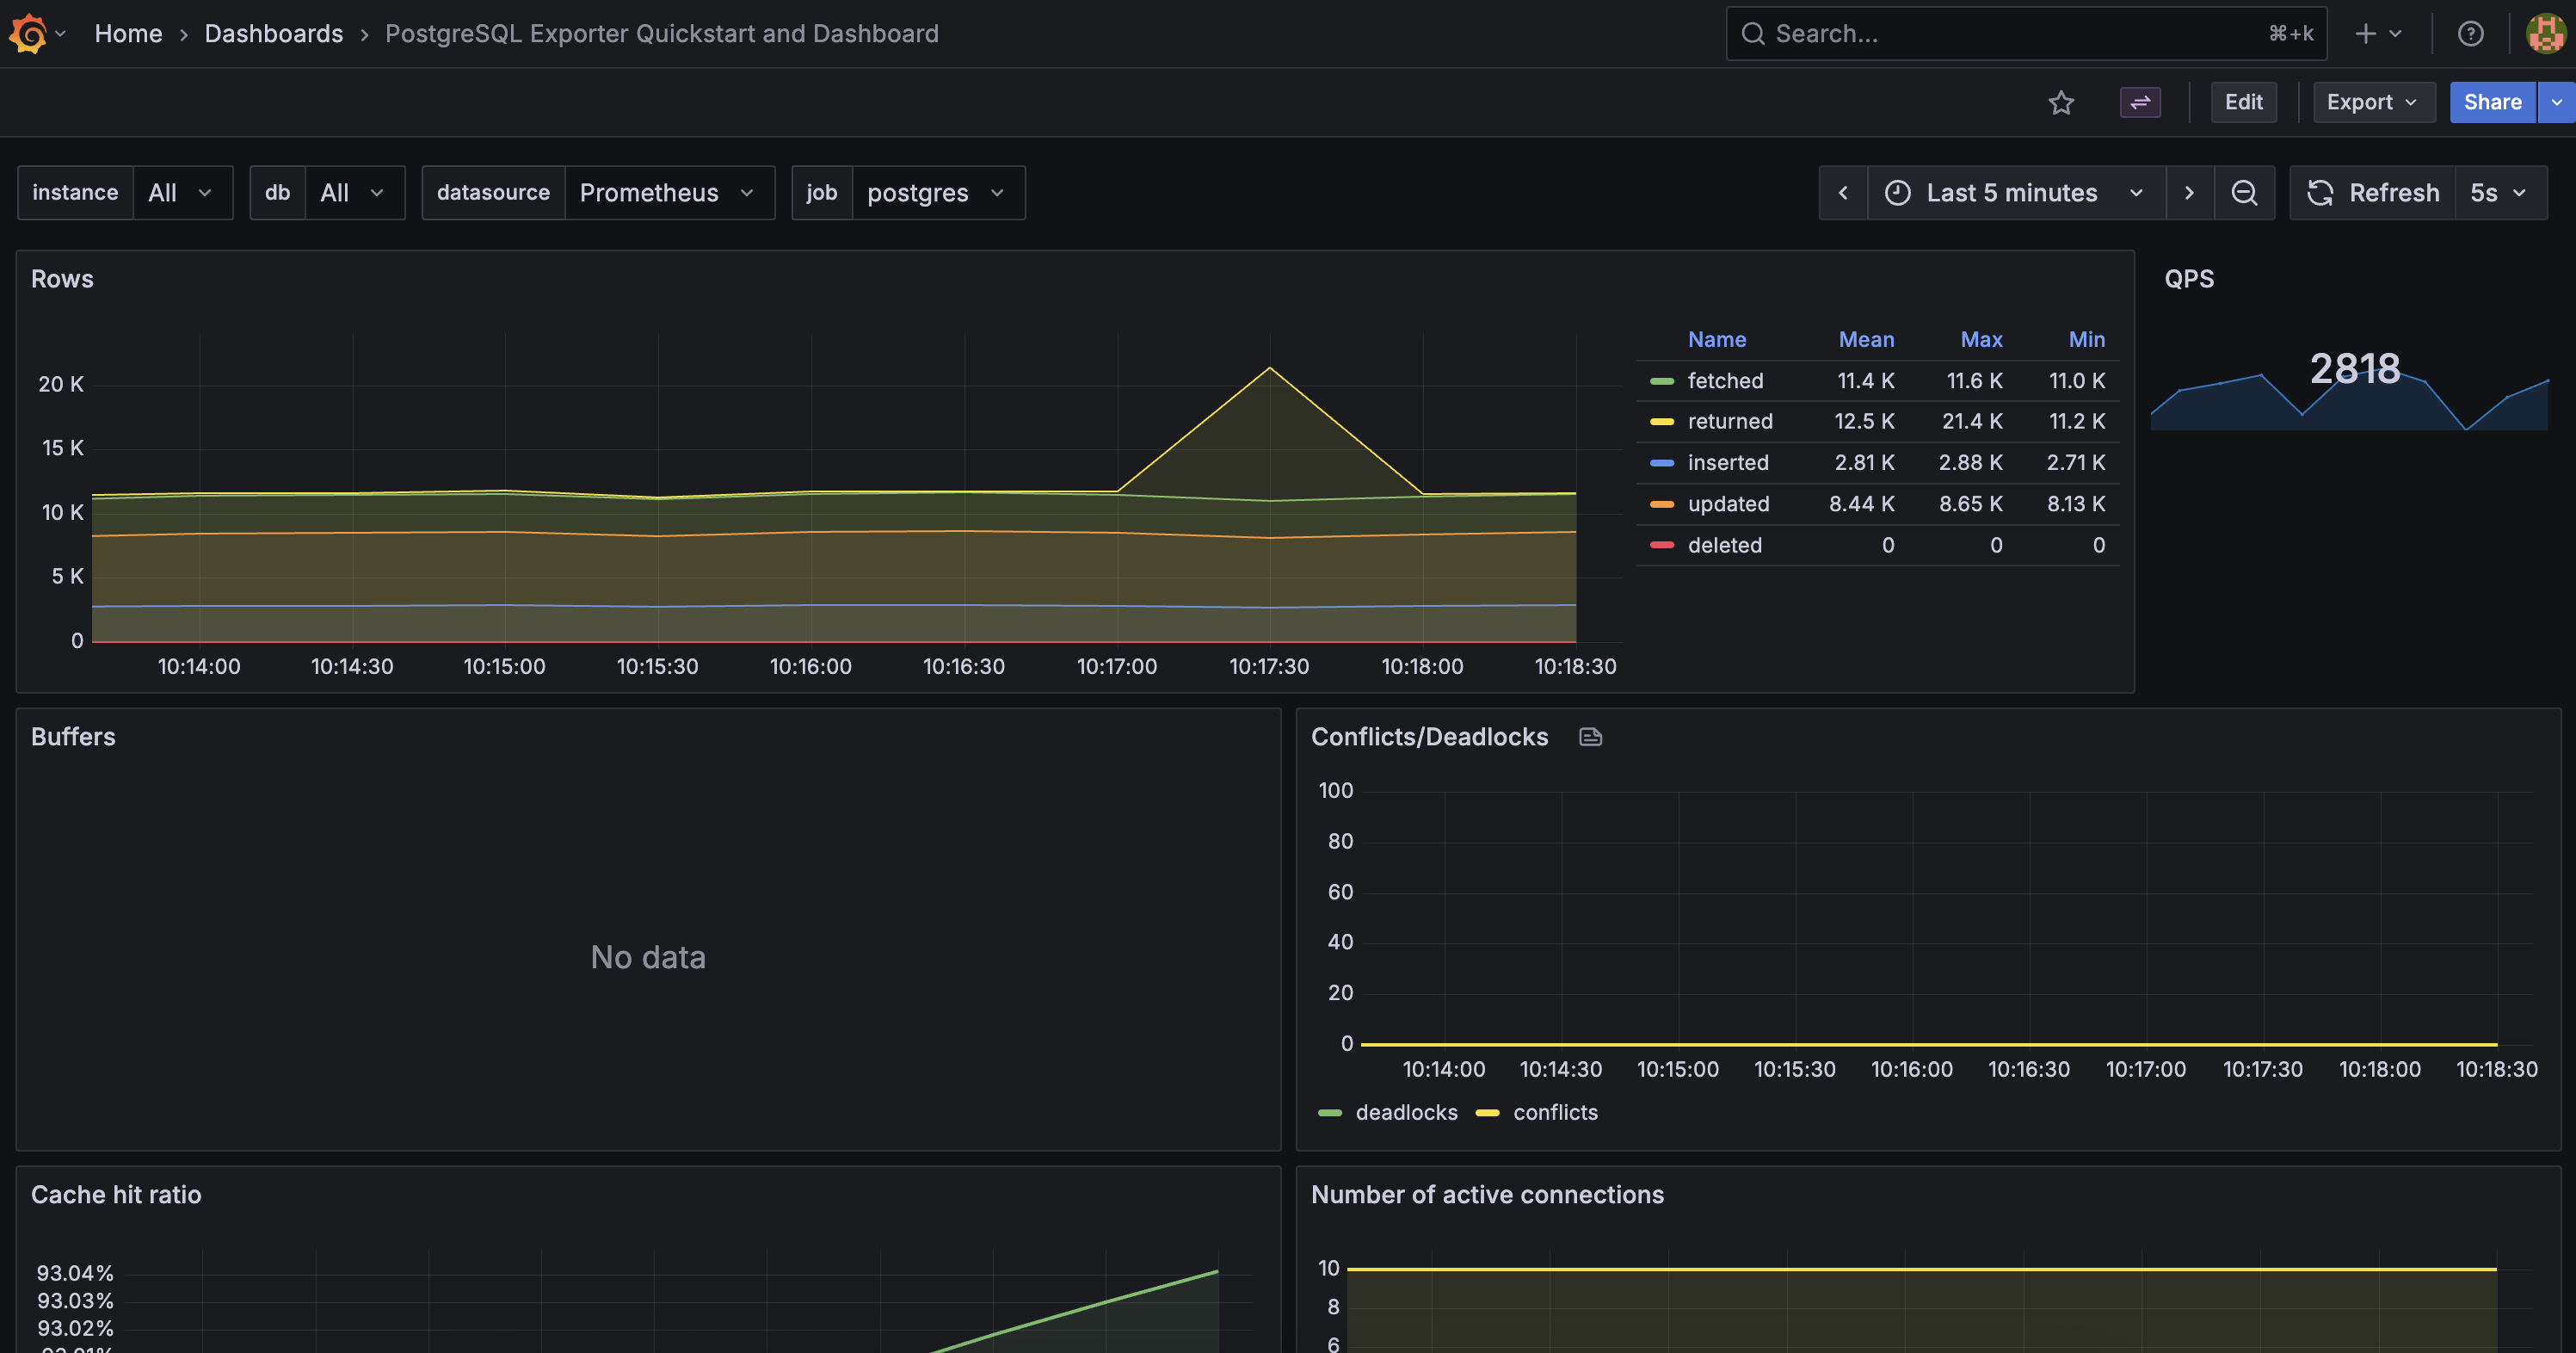 The “Postgres Overview” dashboard highlighting TPS, cache hit ratio, and checkpoints.
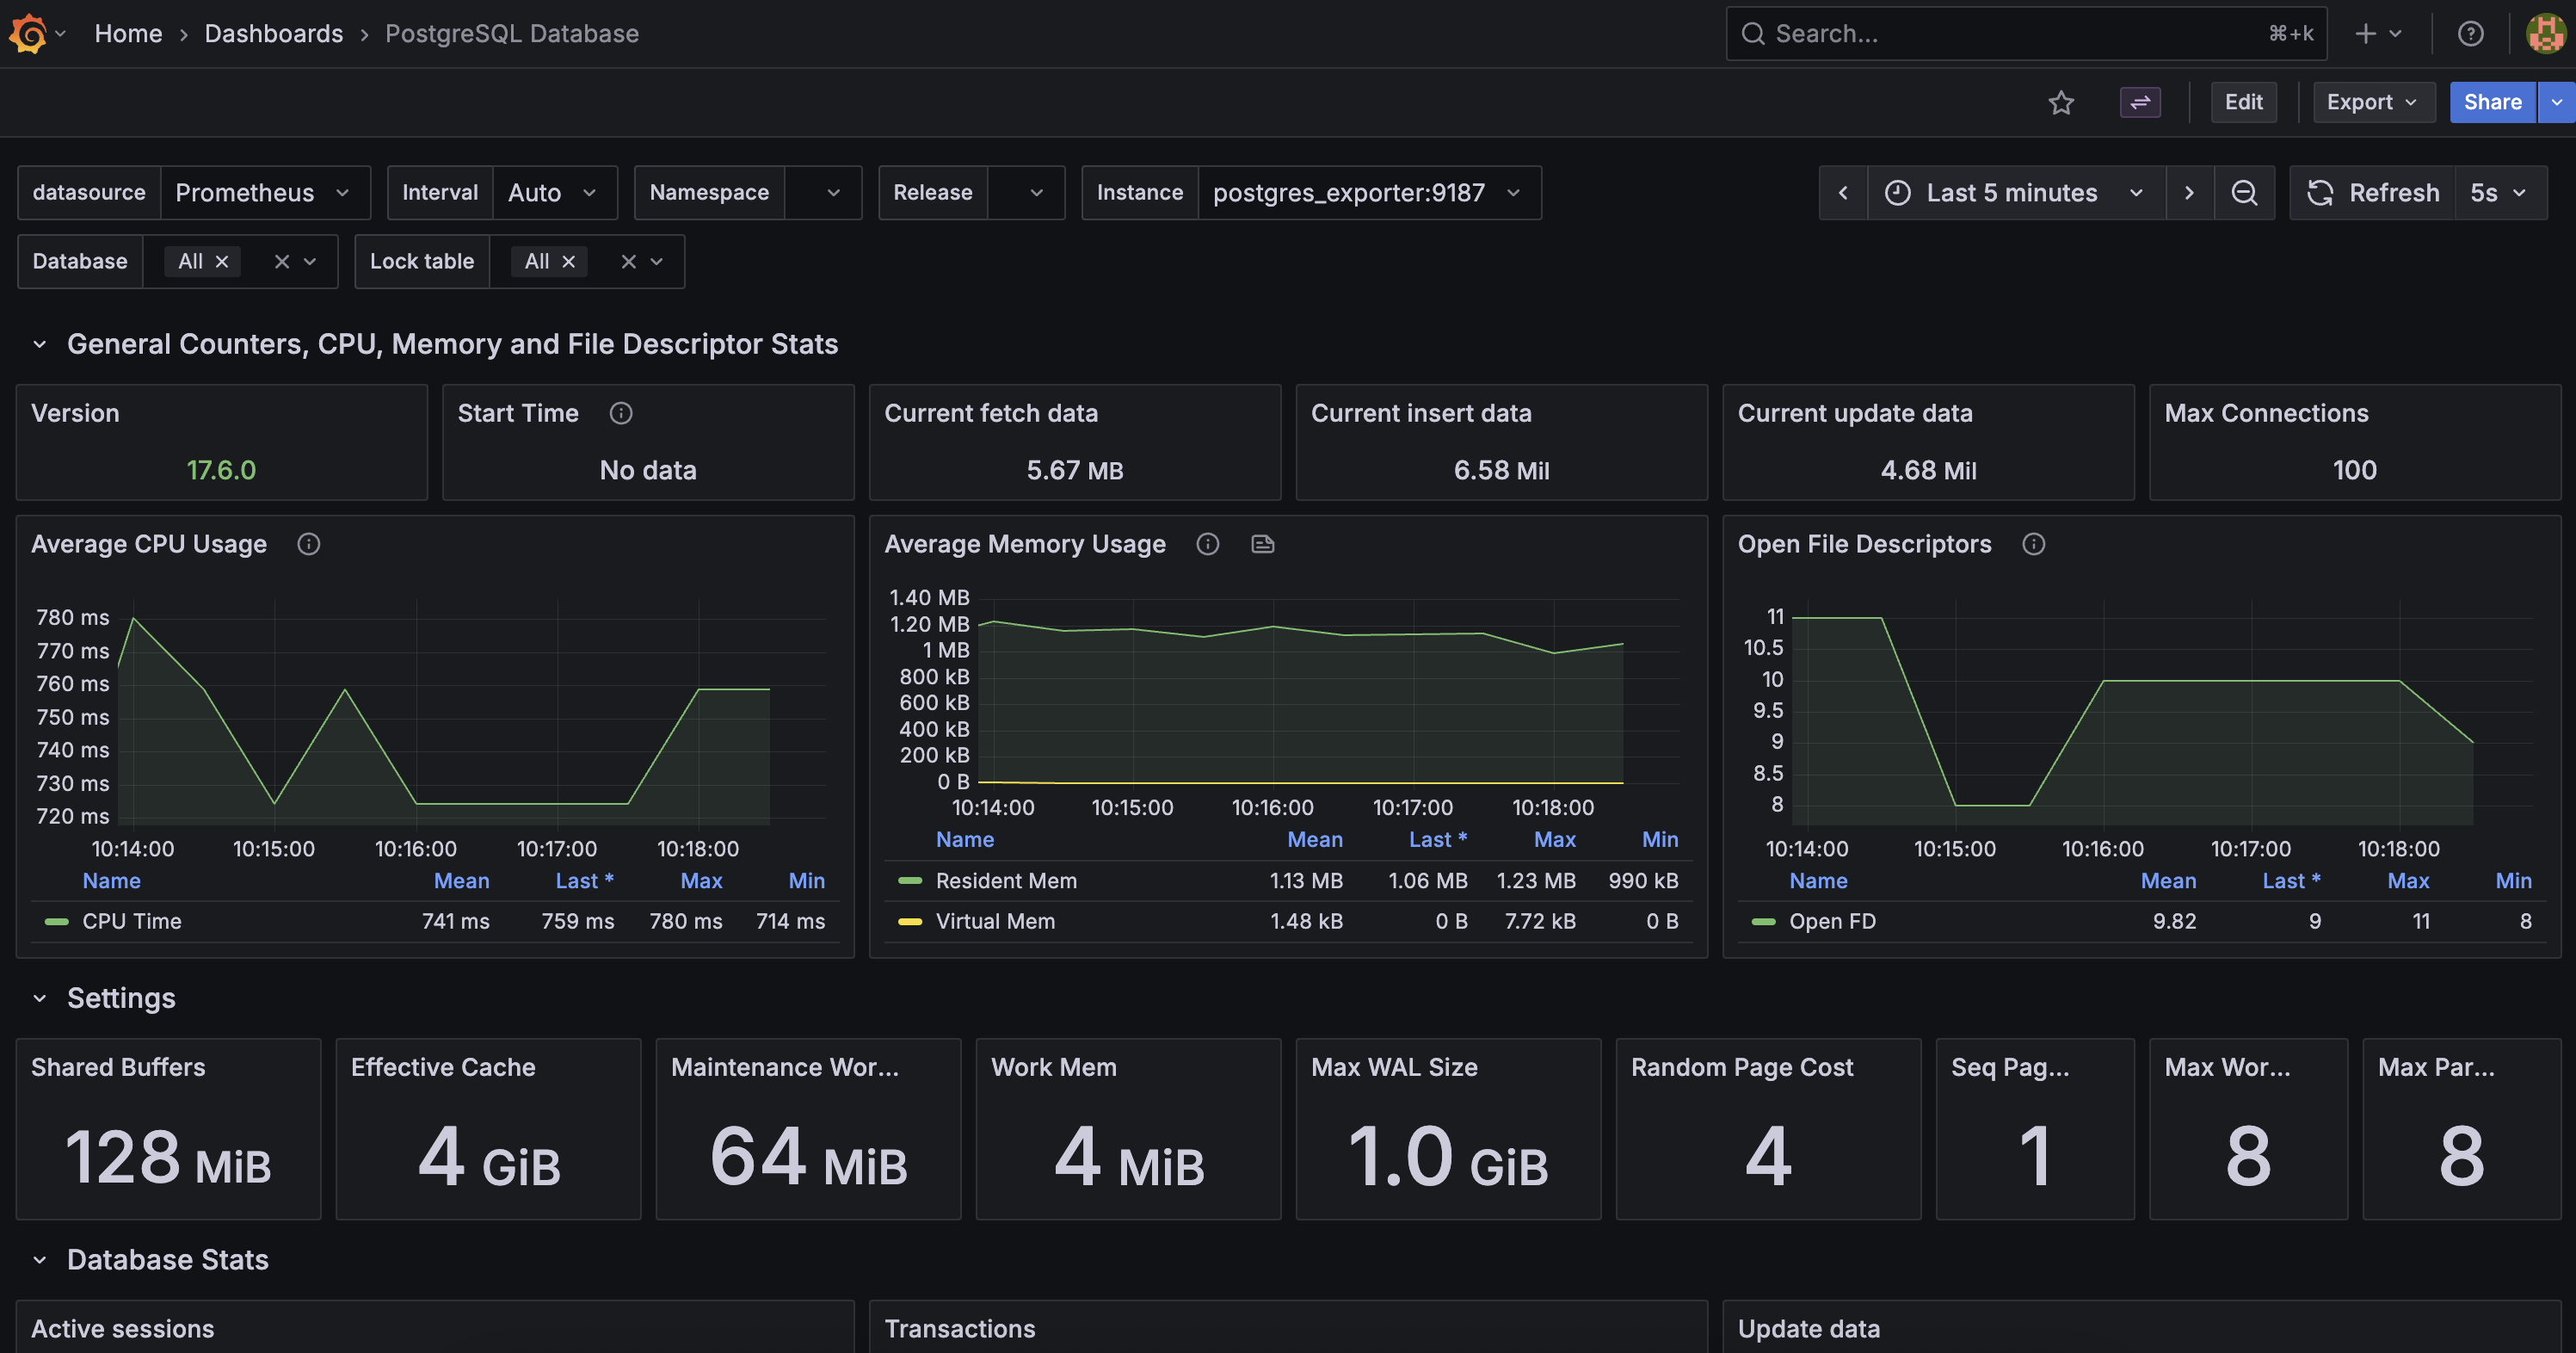 A more complete view including settings, machine metrics, transactions, etc.
cleaning up
To stop everything:
make clean
This shuts down containers and removes volumes.
Why Postgres Exporter Matters
PostgreSQL already exposes rich statistics via system views, but:
- They aren’t time-series friendly.
- They require manual SQL queries.
- They’re ephemeral (reset on restart).
postgres_exporter solves all that:
- Converts stats to Prometheus metrics.
- Preserves history via Prometheus.
- Enables alerting and long-term visualization.
It’s the foundation for observability in PostgreSQL — from personal setups to enterprise clusters.
wrapping up
With less than a hundred lines of YAML and one Makefile, you’ve built a self-contained observability stack that highlights the power of Postgres Exporter.
- Prometheus scrapes the metrics.
- Grafana visualizes them.
pgbenchjust keeps them flowing.
Next time you tune parameters like max_wal_size or work_mem, you’ll see their impact in real time.