Understanding PgBouncer: connection pooling for PostgreSQL

PostgreSQL has a configurable limit on the number of simultaneous client connections:
max_connections. When an application exceeds this limit, Postgres refuses new connections with
FATAL: sorry, too many clients already. This is not a theoretical concern — it is a real
failure mode that affects production systems as they grow.
This article explains what PgBouncer is, how it works, and why it helps. To make the benefits concrete, we will run two benchmarks using pgbench and observe the results in Grafana, comparing direct Postgres connections against connections through PgBouncer.
All code is available at https://github.com/tiagomelo/pgbouncer-demo.
How PostgreSQL manages connections
PostgreSQL uses a process-per-connection model. Every client connection spawns a dedicated backend process on the server. That process allocates memory, holds file descriptors, and participates in lock management for the entire duration of the connection — whether it is executing a query or sitting idle between requests.
This works well at low connection counts. At high connection counts, two problems emerge.
First, Postgres runs out of max_connections slots and starts refusing clients. Second, even
before hitting that limit, the overhead of managing many concurrent backend processes — each
consuming shared memory and competing for resources — begins to degrade throughput.
The underlying issue is that most connections in a typical web application are idle most of the time. A pool of 100 application threads might keep 100 Postgres connections open, but only a handful execute queries at any given moment. The rest hold server resources while doing nothing.
What PgBouncer does
PgBouncer is a connection pooler. It sits between the application and Postgres, accepting client connections on one side and maintaining a small pool of real server connections on the other.
When a client connects to PgBouncer, it does not immediately get a Postgres connection. Instead, PgBouncer assigns the client a server connection from the pool when the client needs to execute a transaction, and returns that connection to the pool when the transaction is complete. From the application’s perspective, it has a connection. From Postgres’s perspective, it only ever sees the small pool.
This means you can have 200 application clients connected to PgBouncer while Postgres only maintains 25 server connections. PgBouncer handles the multiplexing.
Pool modes
PgBouncer supports three pool modes that differ in when server connections are returned to the pool:
Session mode — a server connection is assigned to a client for the entire session. The client holds the connection until it disconnects. This is the most compatible mode but provides the least pooling benefit, since each client still occupies a server connection for its full lifetime.
Transaction mode — a server connection is held only for the duration of a single transaction, then returned to the pool. This is the most efficient mode and the one used in this article. A server connection is only consumed when work is actually being done.
Statement mode — a server connection is returned to the pool after each individual statement. This is rarely used because it breaks multi-statement transactions.
Transaction mode comes with one important limitation: features that maintain state across
transactions do not work. This includes SET session variables, advisory locks,
LISTEN/NOTIFY, and protocol-level prepared statements. For most standard OLTP workloads —
REST APIs, background job processors, microservices — this is not a problem.
The demo setup
To show PgBouncer’s effects concretely, we will run pgbench against Postgres directly and then against PgBouncer, observing the results through Prometheus and Grafana.
The stack runs entirely in Docker:
- PostgreSQL 17 — configured with
max_connections=100 - PgBouncer (
edoburu/pgbouncer) — the connection pooler - postgres_exporter — collects Postgres metrics for Prometheus
- pgbouncer_exporter — collects PgBouncer pool metrics for Prometheus
- Prometheus — stores the metrics
- Grafana — displays the metrics in real time
docker-compose.yaml
services:
  postgres:
    image: postgres:17
    container_name: ${POSTGRES_DATABASE_CONTAINER_NAME}
    command: postgres -c max_connections=$POSTGRES_MAX_CONNECTIONS
    env_file:
      - .env
    ports:
      - "$POSTGRES_PORT:$POSTGRES_PORT"
    volumes:
      - postgres_data:/var/lib/postgresql/data
    healthcheck:
      test: ["CMD-SHELL", "pg_isready -U $POSTGRES_USER -d $POSTGRES_DB"]
      interval: $POSTGRES_HEALTH_CHECK_INTERVAL
      timeout: $POSTGRES_HEALTH_CHECK_TIMEOUT
      retries: $POSTGRES_HEALTH_CHECK_RETRIES
    networks:
      - psqldb-network

  pgbouncer:
    image: edoburu/pgbouncer
    container_name: ${PGBOUNCER_CONTAINER_NAME}
    env_file:
      - .env
    ports:
      - "$PGBOUNCER_PORT:$PGBOUNCER_PORT"
    depends_on:
      postgres:
        condition: service_healthy
    healthcheck:
      test: ["CMD-SHELL", "cat /proc/1/status | grep -q pgbouncer"]
      interval: $PGBOUNCER_HEALTH_CHECK_INTERVAL
      timeout: $PGBOUNCER_HEALTH_CHECK_TIMEOUT
      retries: $PGBOUNCER_HEALTH_CHECK_RETRIES
    networks:
      - psqldb-network

  postgres_exporter:
    image: quay.io/prometheuscommunity/postgres-exporter
    container_name: ${POSTGRES_EXPORTER_CONTAINER_NAME}
    env_file:
      - .env
    environment:
      DATA_SOURCE_URI: "postgres:${POSTGRES_PORT}/${POSTGRES_DB}?sslmode=disable"
      DATA_SOURCE_USER: "${POSTGRES_USER}"
      DATA_SOURCE_PASS: "${POSTGRES_PASSWORD}"
    ports:
      - "$POSTGRES_EXPORTER_PORT:$POSTGRES_EXPORTER_PORT"
    networks:
      - psqldb-network
    depends_on:
      - postgres
    restart: always

  pgbouncer_exporter:
    image: prometheuscommunity/pgbouncer-exporter
    container_name: ${PGBOUNCER_EXPORTER_CONTAINER_NAME}
    command:
      - "--pgBouncer.connectionString=postgres://test:test@pgbouncer:6432/pgbouncer?sslmode=disable"
    ports:
      - "9127:9127"
    networks:
      - psqldb-network
    depends_on:
      - pgbouncer
    restart: on-failure

  renderer:
    image: grafana/grafana-image-renderer:latest
    container_name: ${GRAFANA_RENDERER_CONTAINER_NAME}
    expose:
      - "$GRAFANA_RENDERING_PORT"
    networks:
      - psqldb-network
    restart: on-failure

  grafana:
    image: grafana/grafana:latest
    container_name: ${GRAFANA_CONTAINER_NAME}
    ports:
      - 3000:3000
    env_file:
      - .env
    volumes:
      - grafana_data:/var/lib/grafana
      - ./grafana/dashboards:/etc/grafana/provisioning/dashboards
      - ./grafana/datasources:/etc/grafana/provisioning/datasources
    networks:
      - psqldb-network
    depends_on:
      - renderer

  prometheus:
    image: prom/prometheus:latest
    container_name: ${PROMETHEUS_CONTAINER_NAME}
    volumes:
      - ./prometheus/prometheus.yml:/etc/prometheus/prometheus.yml:ro
      - prometheus_data:/prometheus
    ports:
      - "$PROMETHEUS_PORT:$PROMETHEUS_PORT"
    networks:
      - psqldb-network
    depends_on:
      - postgres_exporter
    restart: on-failure

networks:
  psqldb-network:
    driver: bridge

volumes:
  grafana_data:
  postgres_data:
  prometheus_data:
PgBouncer Configuration
The edoburu/pgbouncer image generates pgbouncer.ini from environment variables at startup:
PGBOUNCER_PORT=6432
DB_HOST=postgres
DB_USER=test
DB_PASSWORD=test
DB_NAME=testdb
POOL_MODE=transaction
MAX_CLIENT_CONN=300
DEFAULT_POOL_SIZE=25
LISTEN_PORT=6432
AUTH_TYPE=plain
STATS_USERS=test
ADMIN_USERS=test
DEFAULT_POOL_SIZE=25 means PgBouncer will maintain at most 25 real Postgres connections,
regardless of how many clients are connected to it. MAX_CLIENT_CONN=300 sets the maximum
number of clients that can connect to PgBouncer itself.
STATS_USERS and ADMIN_USERS grant the test user access to PgBouncer’s internal statistics
interface. This is required by pgbouncer_exporter to collect pool metrics — without it, the
exporter connects successfully but cannot query pool data.
The pgbouncer_exporter
pgbouncer_exporter collects pool metrics by connecting to PgBouncer’s internal virtual
database called pgbouncer, which exposes statistics through special SHOW commands such as
SHOW POOLS and SHOW STATS. It requires the connection string as a CLI flag:
command:
  - "--pgBouncer.connectionString=postgres://test:test@pgbouncer:6432/pgbouncer?sslmode=disable"
Note that the database in the connection string is pgbouncer, not your application database.
This virtual database only exists inside PgBouncer — it is not a real Postgres database.
Prometheus configuration
scrape_configs:
  - job_name: 'postgres'
    scrape_interval: 10s
    static_configs:
      - targets: ['postgres_exporter:9187']
  - job_name: 'pgbouncer'
    scrape_interval: 10s
    static_configs:
      - targets: ['pgbouncer_exporter:9127']
Grafana provisioning
Grafana loads dashboards and datasources automatically from the filesystem on startup via
provisioning configuration files in grafana/dashboards/ and grafana/datasources/. Both
benchmark dashboards are version-controlled as JSON and available immediately on first run
without any manual setup.
I have some articles showing how to provision dashboards and datasources:
- Observability in Go with Prometheus and Grafana: From Metrics to Dashboards
- Golang: out-of-box backpressure handling with gRPC, proven by a Grafana dashboard
What we measure
To make the comparison meaningful, we track the same metrics during both benchmarks:
Connection utilization — how much of max_connections is consumed, and how many connections
are active vs idle in Postgres at any given time. This shows directly how PgBouncer changes
Postgres’s view of the workload.
Throughput — transactions per second committed to the database, measured from
pg_stat_database.
Memory pressure — the rate of buffer allocations and bgwriter activity from
pg_stat_bgwriter. High connection counts cause Postgres to allocate more shared memory and
work the bgwriter harder.
The PgBouncer dashboard adds one additional panel that has no equivalent in the direct benchmark: the pool utilization chart showing client connections, waiting clients, active server connections, and idle server connections side by side. This panel directly illustrates the multiplexing happening inside PgBouncer.
Running the Benchmarks
make setup               # clean start + initialize pgbench data (run once)
make benchmark-direct    # run direct Postgres benchmark — Ctrl-C when done
make reset               # reset pgbench schema between runs
make benchmark-pgbouncer # run PgBouncer benchmark — Ctrl-C when done
make clean               # tear everything down
pgbench is initialized with SCALE_FACTOR=50, creating approximately 7.2 million rows. The
benchmark parameters:
SCALE_FACTOR=50
PSQL_NUMBER_OF_CLIENTS=80
PGBOUNCER_NUMBER_OF_CLIENTS=200
NUMBER_OF_THREADS=8
The direct benchmark uses 80 clients. The PgBouncer benchmark uses 200 — 2.5x more load.
Both use -M simple because PgBouncer in transaction mode does not support protocol-level
prepared statements.
Benchmark results
Direct Postgres (5 minutes, 80 clients)
In this scenario, pgbench connects directly to Postgres with 80 clients and 8 threads,
bypassing PgBouncer entirely. Postgres has max_connections=100, leaving roughly 92 slots
available before pgbench starts — accounting for internal connections from the exporter and
other services.
What we observed
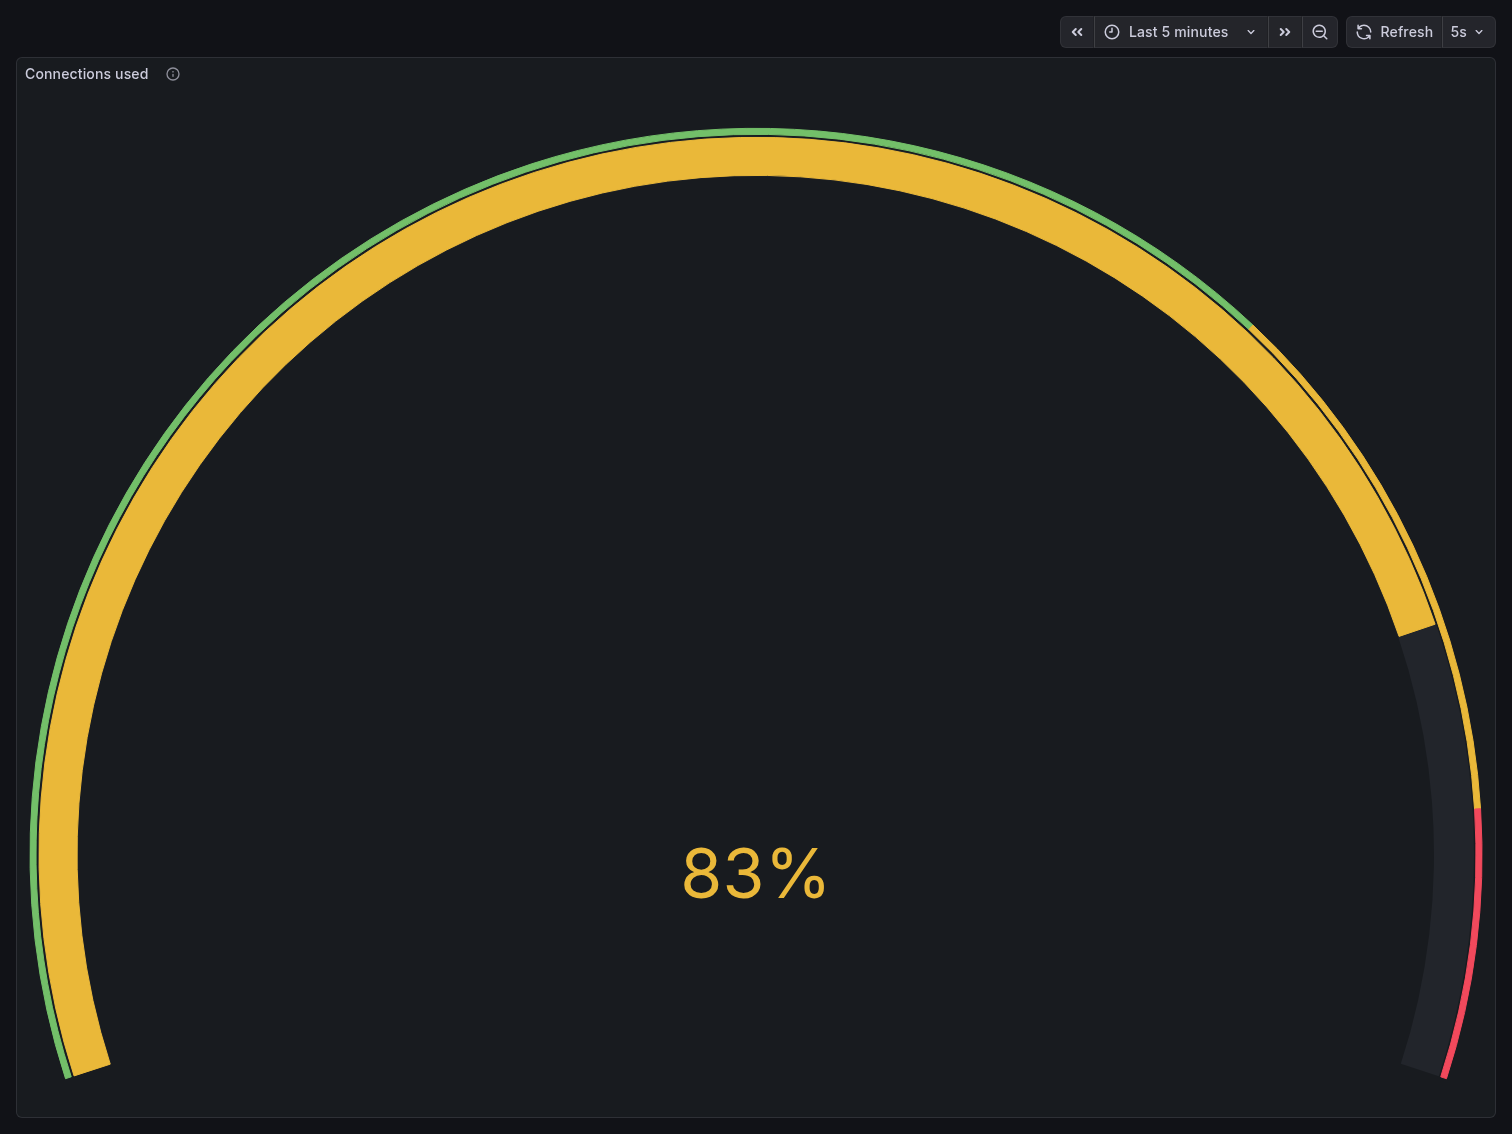
Connections under pressure
The Connections Used gauge peaked at 83% — meaning ~83 out of 100 connection slots were
consumed by client activity alone. With postgres_exporter, PgBouncer, and Postgres internal
processes already occupying several slots, the system was operating dangerously close to its
ceiling. Any additional connection spike would have triggered FATAL: sorry, too many clients
already.
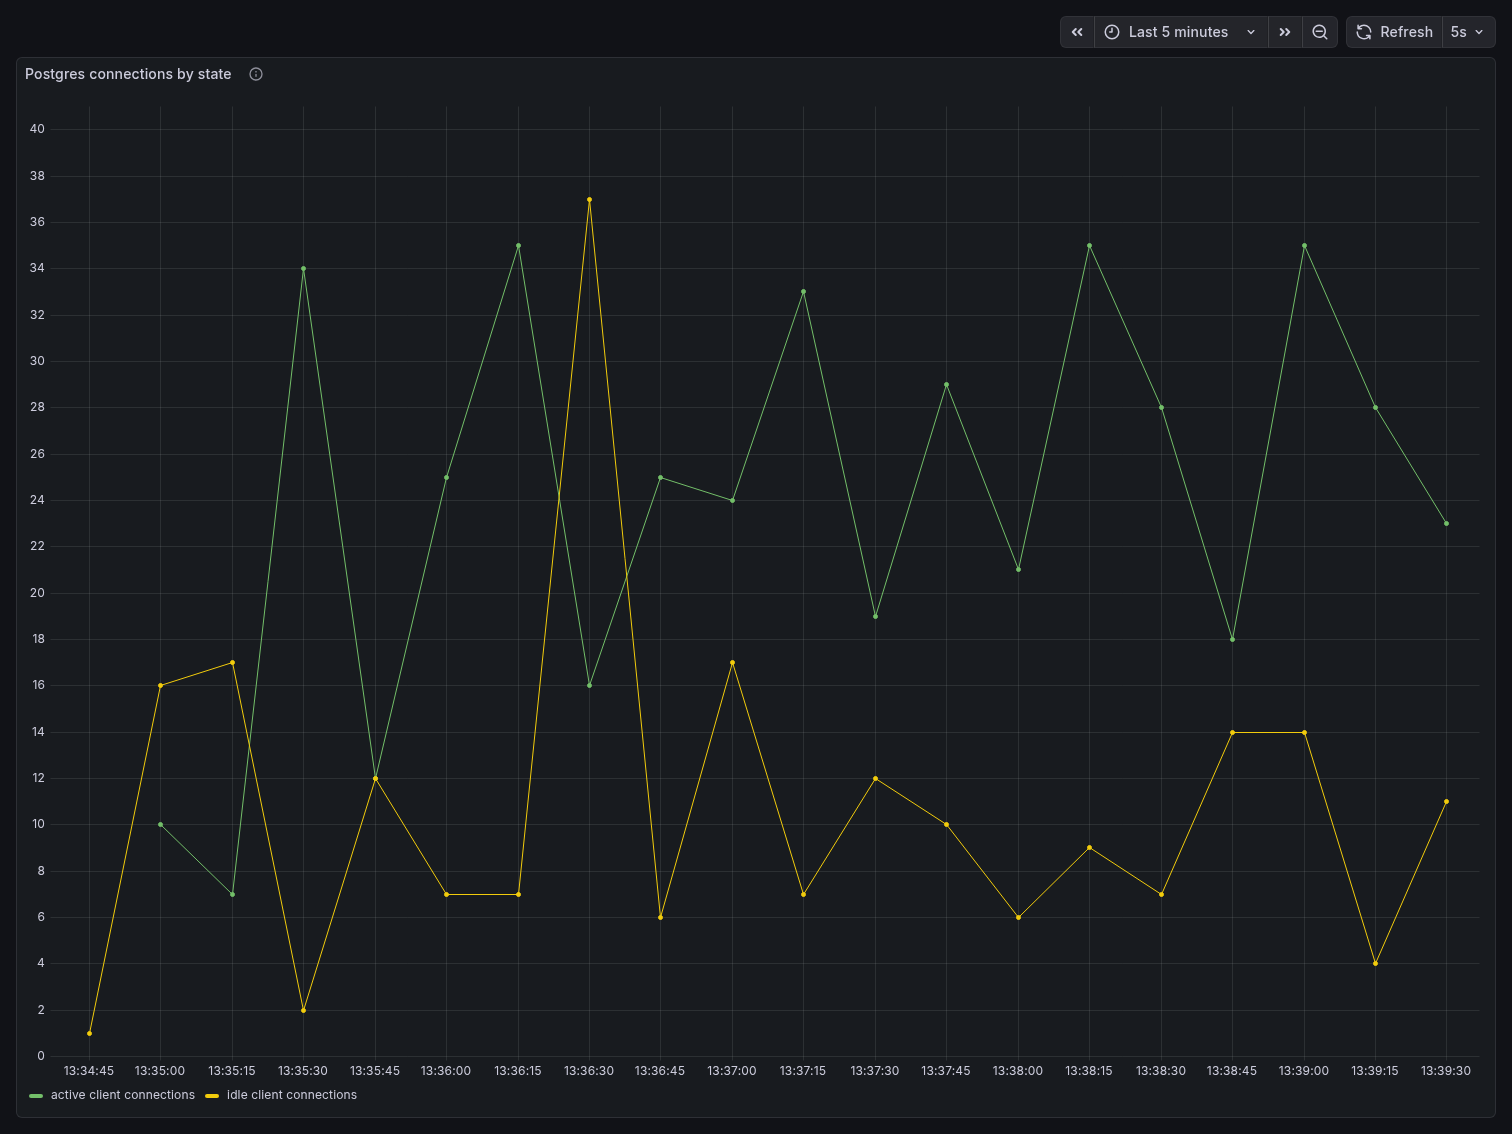
The Postgres Connections by State panel tells a more detailed story. Active and idle connections fluctuated heavily and out of phase — active connections spiked up to 34 while idle connections dropped near zero, then the pattern reversed. This sawtooth behavior reflects pgbench clients cycling through transactions: they go active during a query, briefly idle between transactions, then active again. At 80 clients, Postgres is handling all of this connection lifecycle management directly, with no buffering layer in between.
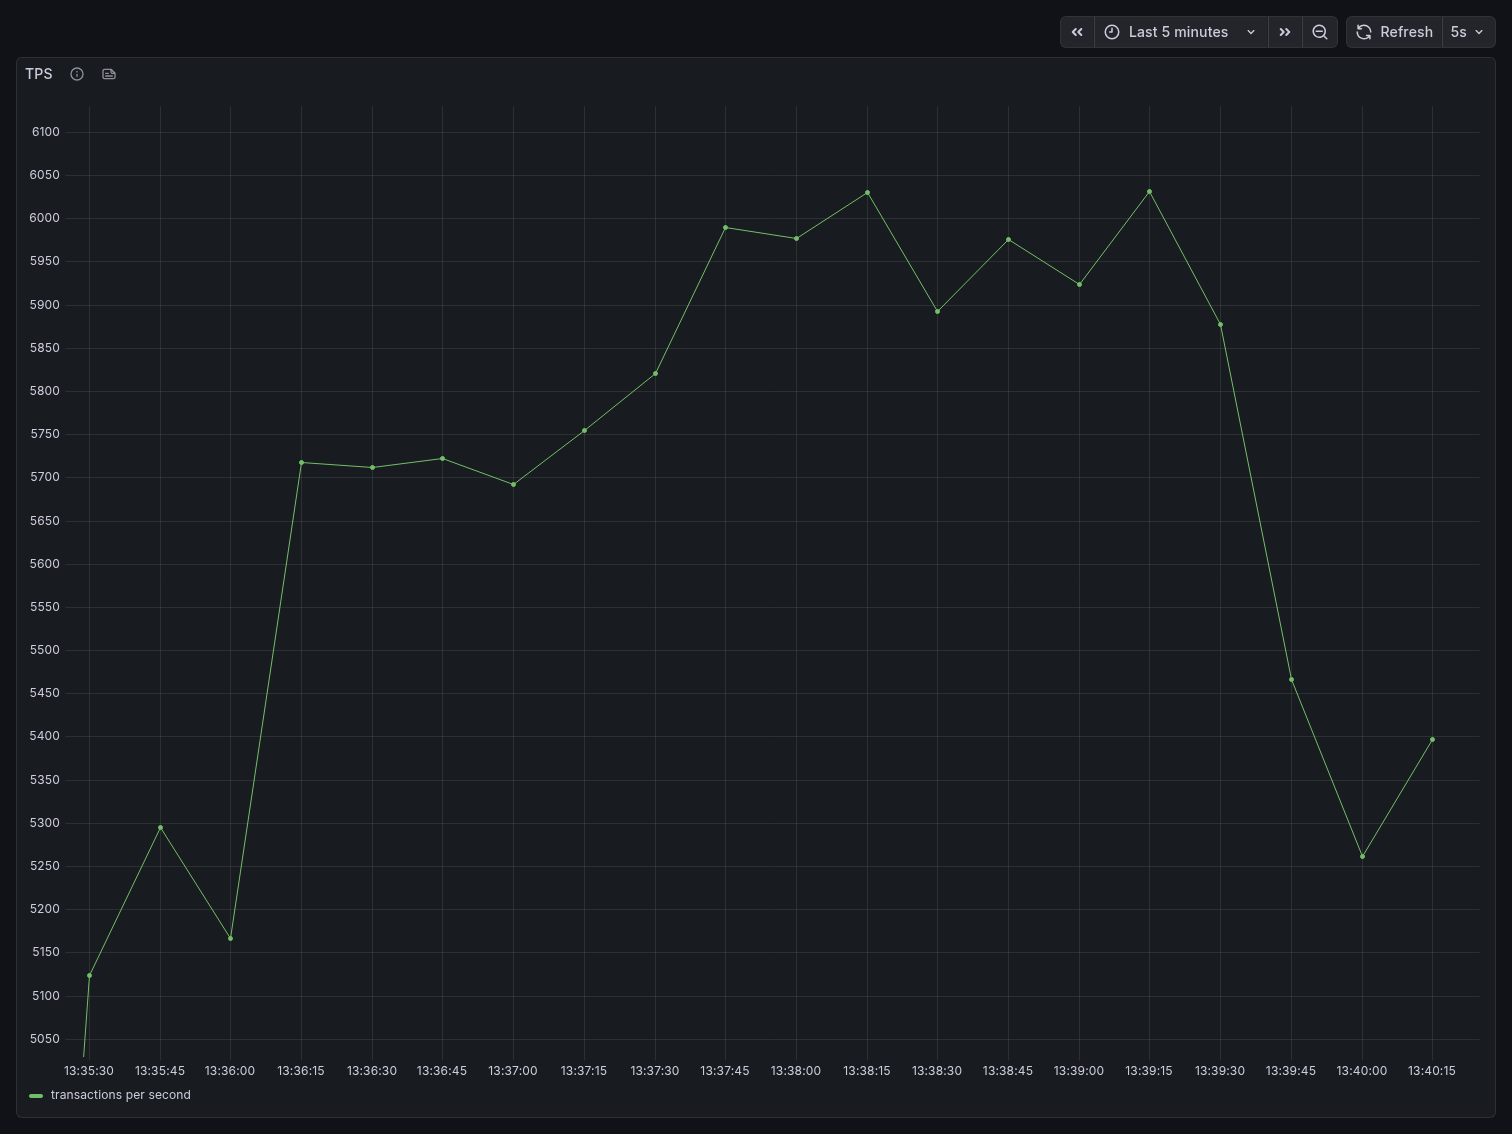
Throughput
TPS started around 5,100 at the beginning of the benchmark, climbed steadily to a peak of approximately 6,040 around the 2-minute mark, then began degrading. By the end of the 5-minute window, TPS had dropped back to roughly 5,200-5,400, showing visible instability with frequent oscillation. This degradation is characteristic of connection saturation — as more connections compete for Postgres resources, throughput stops scaling and begins declining.
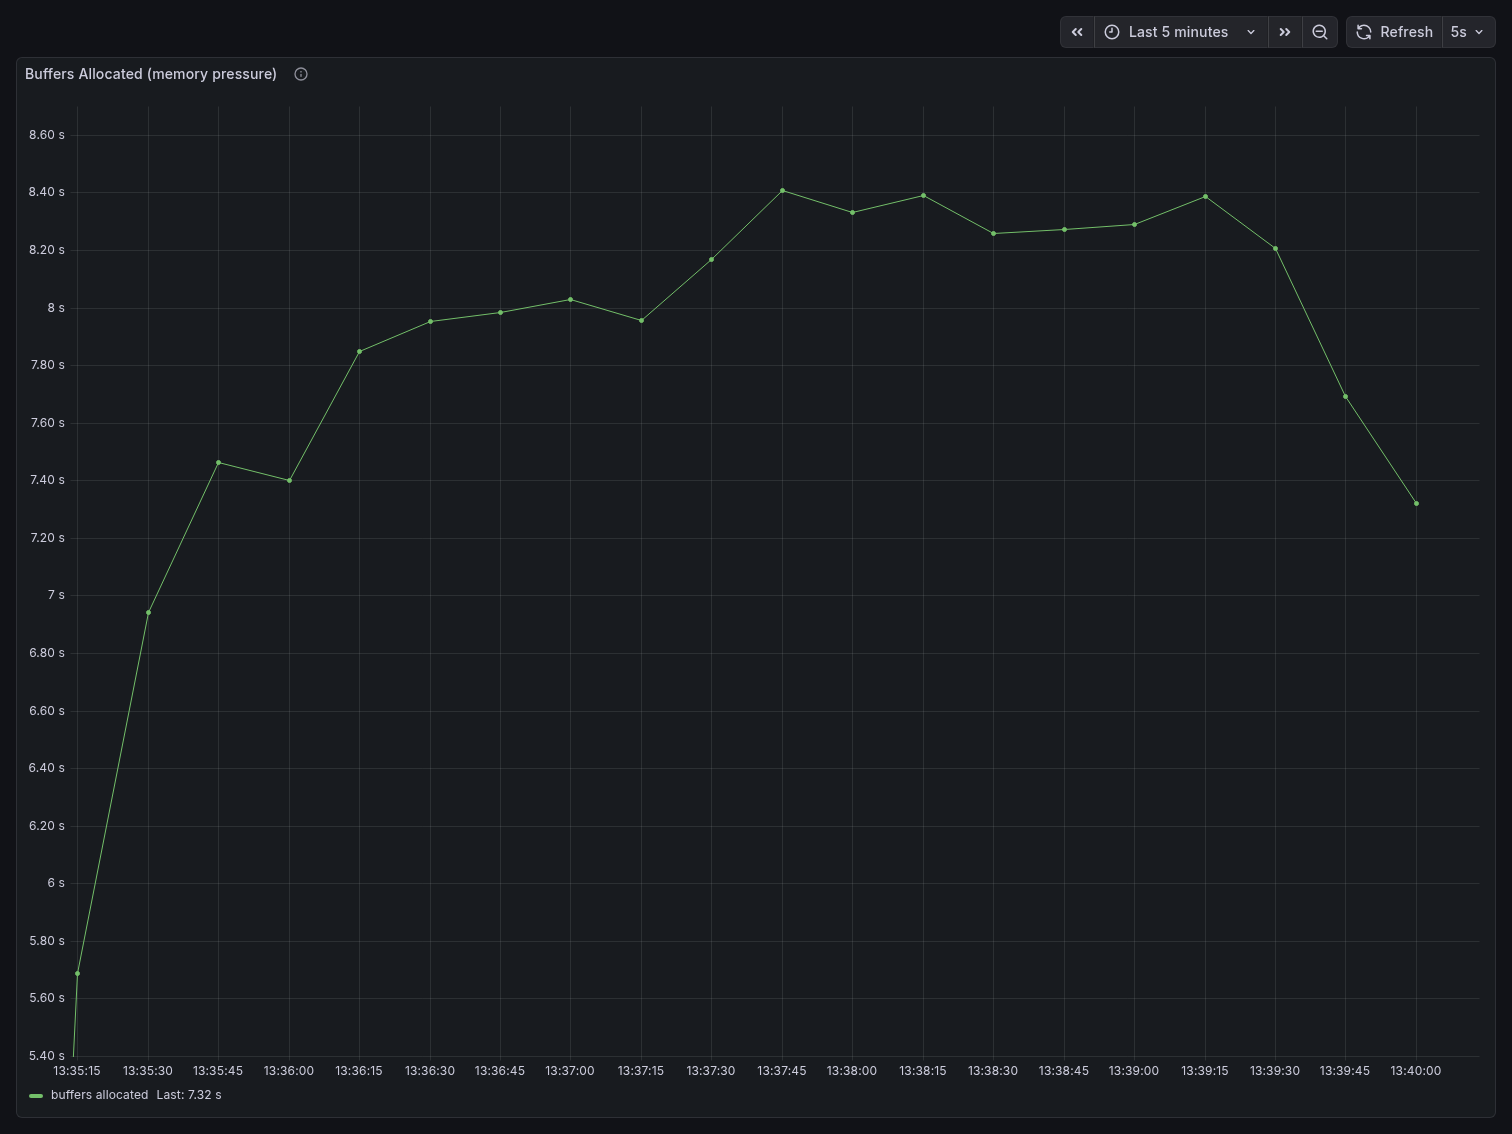
Memory pressure
Buffers Allocated rose sharply from ~5.6s at the start to a sustained plateau around 8.4s — a ~50% increase. This reflects Postgres constantly allocating shared buffer space to service a large number of concurrent connections, each maintaining its own memory state.
Buffers Cleaned by bgwriter jumped from ~360 at the start to a sustained ~490-495, an increase of roughly 35%. The bgwriter is working harder to reclaim dirty buffers because the high connection count is consuming shared memory faster than Postgres can reuse it.
Key takeaway
With 80 direct clients, Postgres consumed 83% of its connection budget, showed TPS degradation
over time, and increased memory pressure by ~50%. This is with only 80 clients — well below the
max_connections limit. Attempting 200 direct clients, as we confirmed earlier, results in
immediate connection refusal errors.
This is the baseline the PgBouncer benchmark is measured against.
PgBouncer (10 minutes, 200 clients)
In this scenario, the same pgbench workload runs through PgBouncer with 200 clients and
8 threads — 2.5x more clients than the direct benchmark. PgBouncer is configured with
pool_mode=transaction, max_client_conn=300, and default_pool_size=25, meaning all 200
client connections are served through a maximum of 25 real Postgres connections.
What we observed
Connection multiplexing
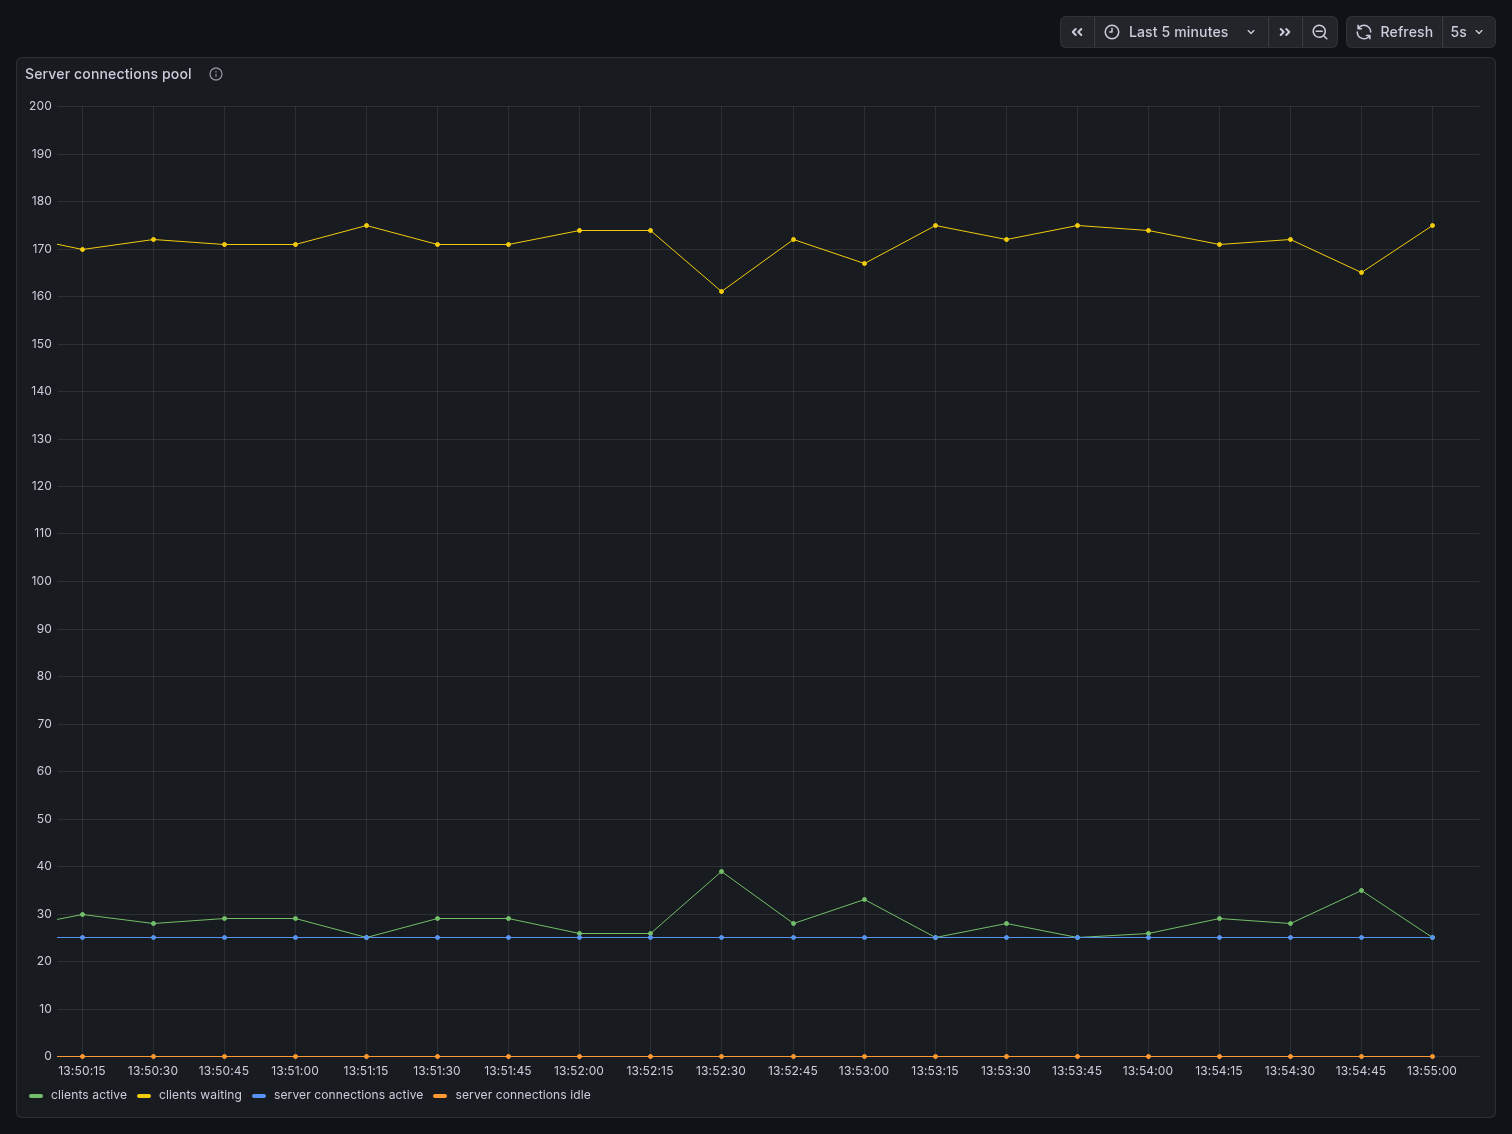
The Server Connections Pool panel is where the story becomes undeniable. The yellow line — clients waiting — hovered consistently around 170, representing the 200 pgbench clients minus those actively in a transaction at any given moment. The green line — clients active — stayed around 25-40, spiking occasionally to ~39 under burst load. The blue line — server connections active — remained remarkably flat at ~25, never exceeding the pool size. Server connections idle stayed near zero, meaning the pool was being used efficiently with almost no wasted capacity.
200 application clients. 25 Postgres connections. That is PgBouncer’s core value proposition visible in a single chart.
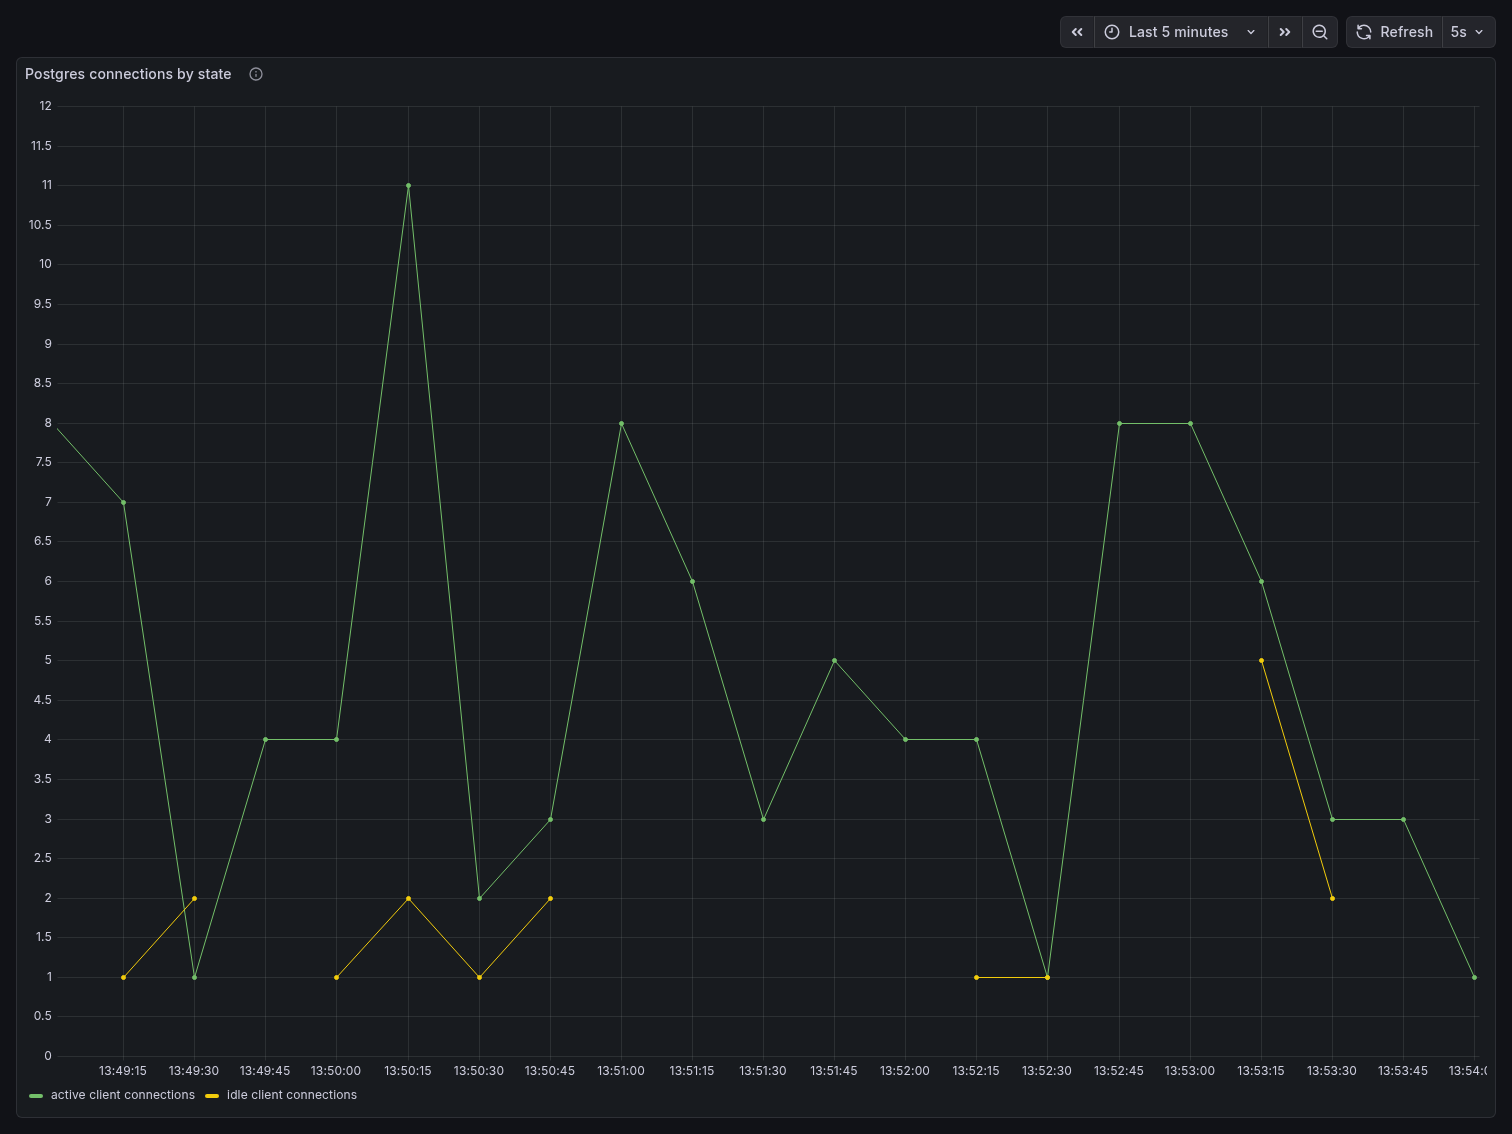
The Postgres Connections by State panel confirms this from the database side. Active connections to Postgres never exceeded 11, and idle connections stayed between 1 and 5 throughout the entire benchmark. Postgres had no idea 200 clients existed — it only ever saw the small, controlled pool PgBouncer presented to it.
Connections used
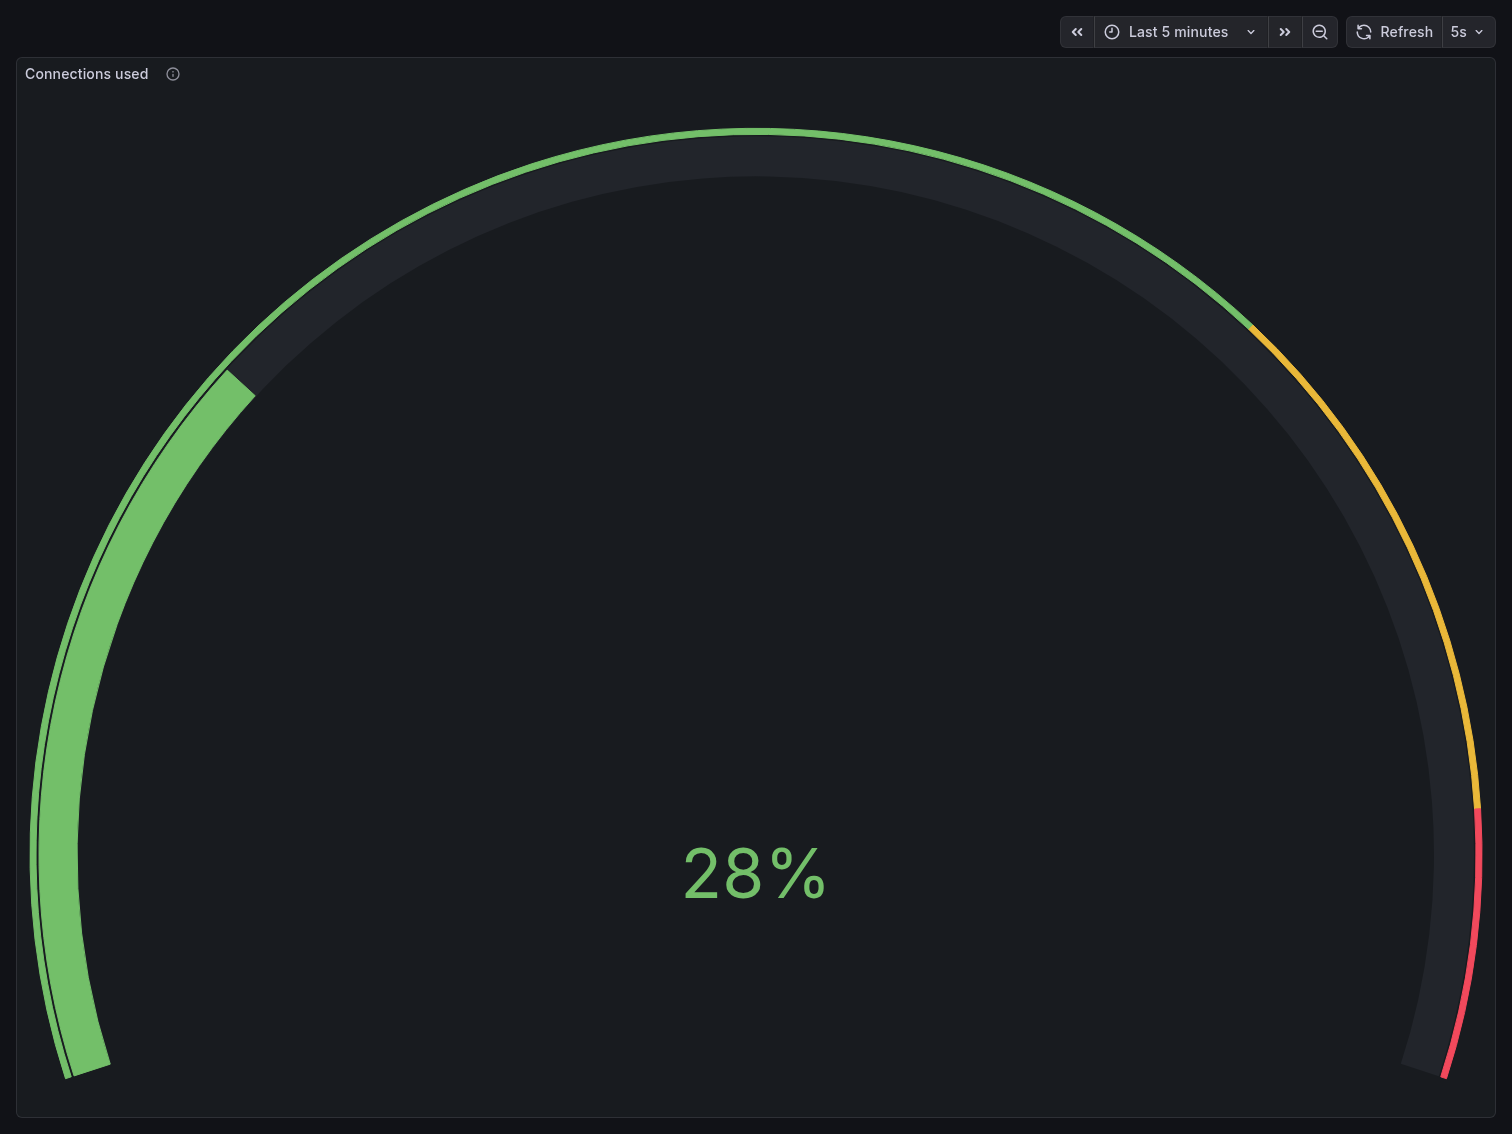
The Connections Used gauge held at a steady 28% throughout the entire benchmark — the
same reading seen when the stack was idle. With default_pool_size=25, PgBouncer consumed only
25 out of 100 Postgres connection slots regardless of how many application clients were
connected. Compare this to the direct benchmark’s 83%, achieved with less than half the client
count.
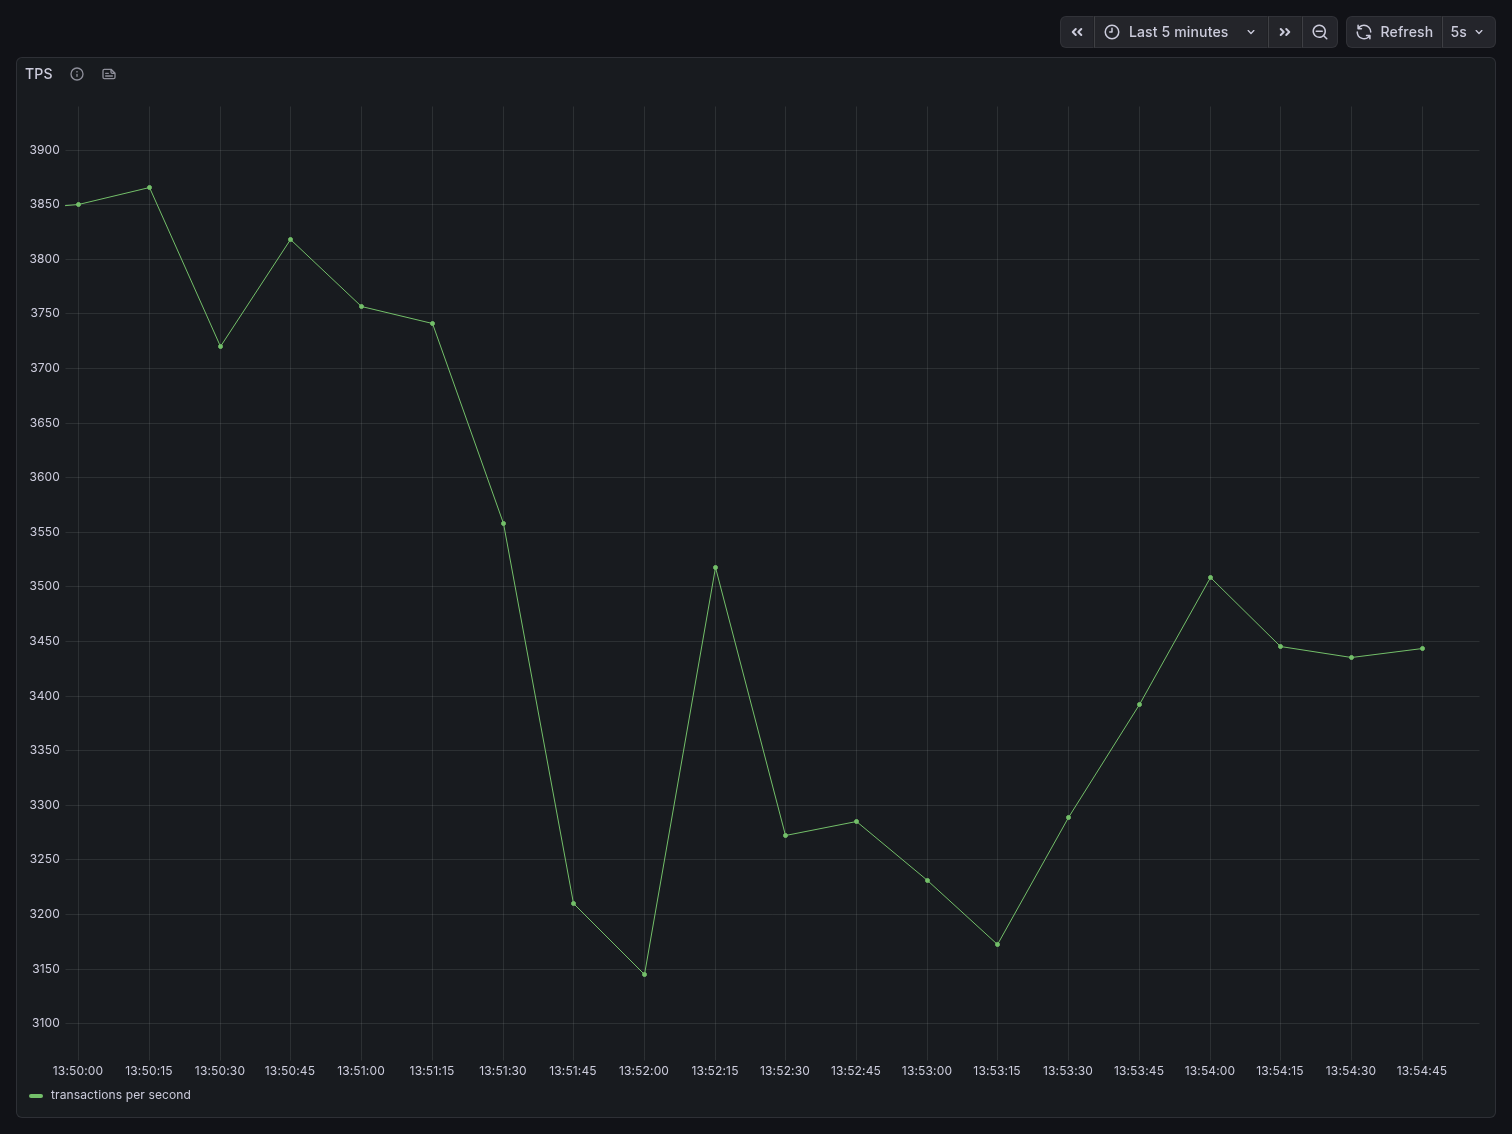
Throughput
TPS started around 3,850 and showed a gradual decline over the 5-minute window, settling
around 3,150-3,500 by the end. This is lower than the direct benchmark’s peak of ~6,040,
which warrants explanation: with 200 clients sharing 25 server connections in transaction mode,
clients that are not in an active transaction must wait for a server connection to become
available. The throughput reflects the bottleneck of the pool size, not Postgres capacity. In a
real-world scenario, default_pool_size would be tuned upward (while staying well under
max_connections) to increase throughput while still preserving the connection budget advantage.
The key distinction is stability: direct Postgres showed degradation and oscillation under pressure. PgBouncer showed a predictable, controlled decline — the system remained in full control throughout.
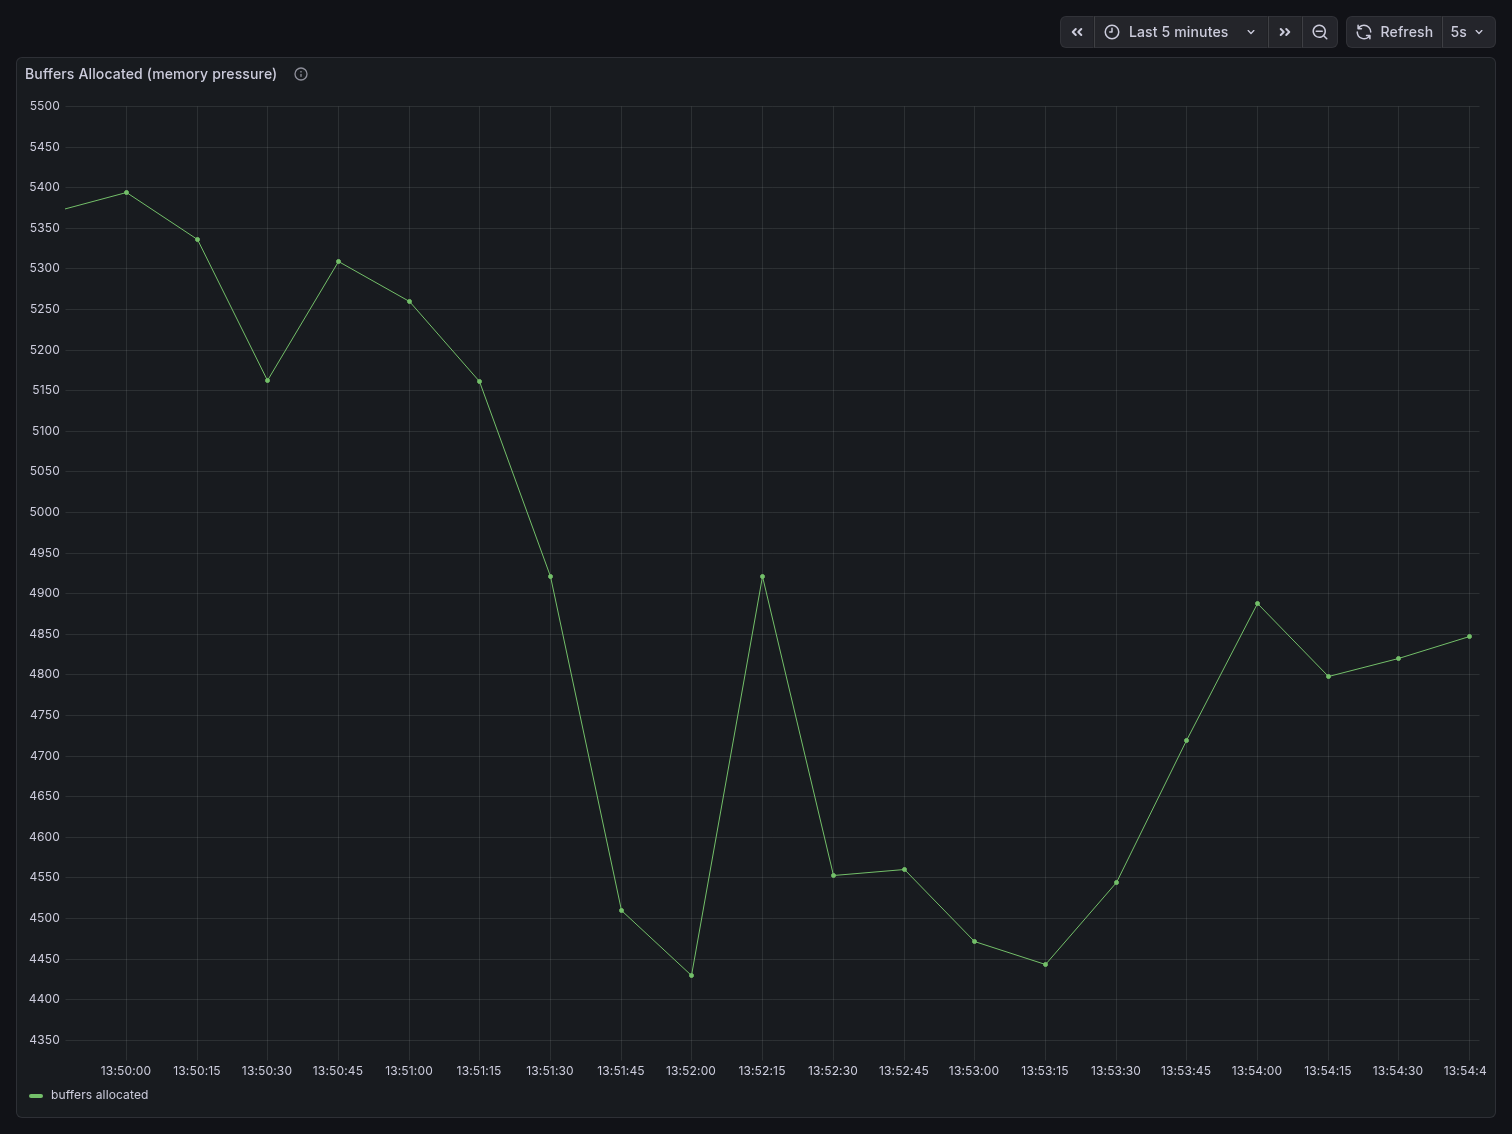
Memory pressure
Buffers Allocated dropped significantly compared to the direct benchmark. Starting around 5,370 at the beginning, it declined steadily to a floor of ~4,400 — roughly 13-18% lower than the direct benchmark’s sustained plateau of ~8,400. With Postgres only managing 25 real connections instead of 80, it allocates far less shared memory per scrape interval.
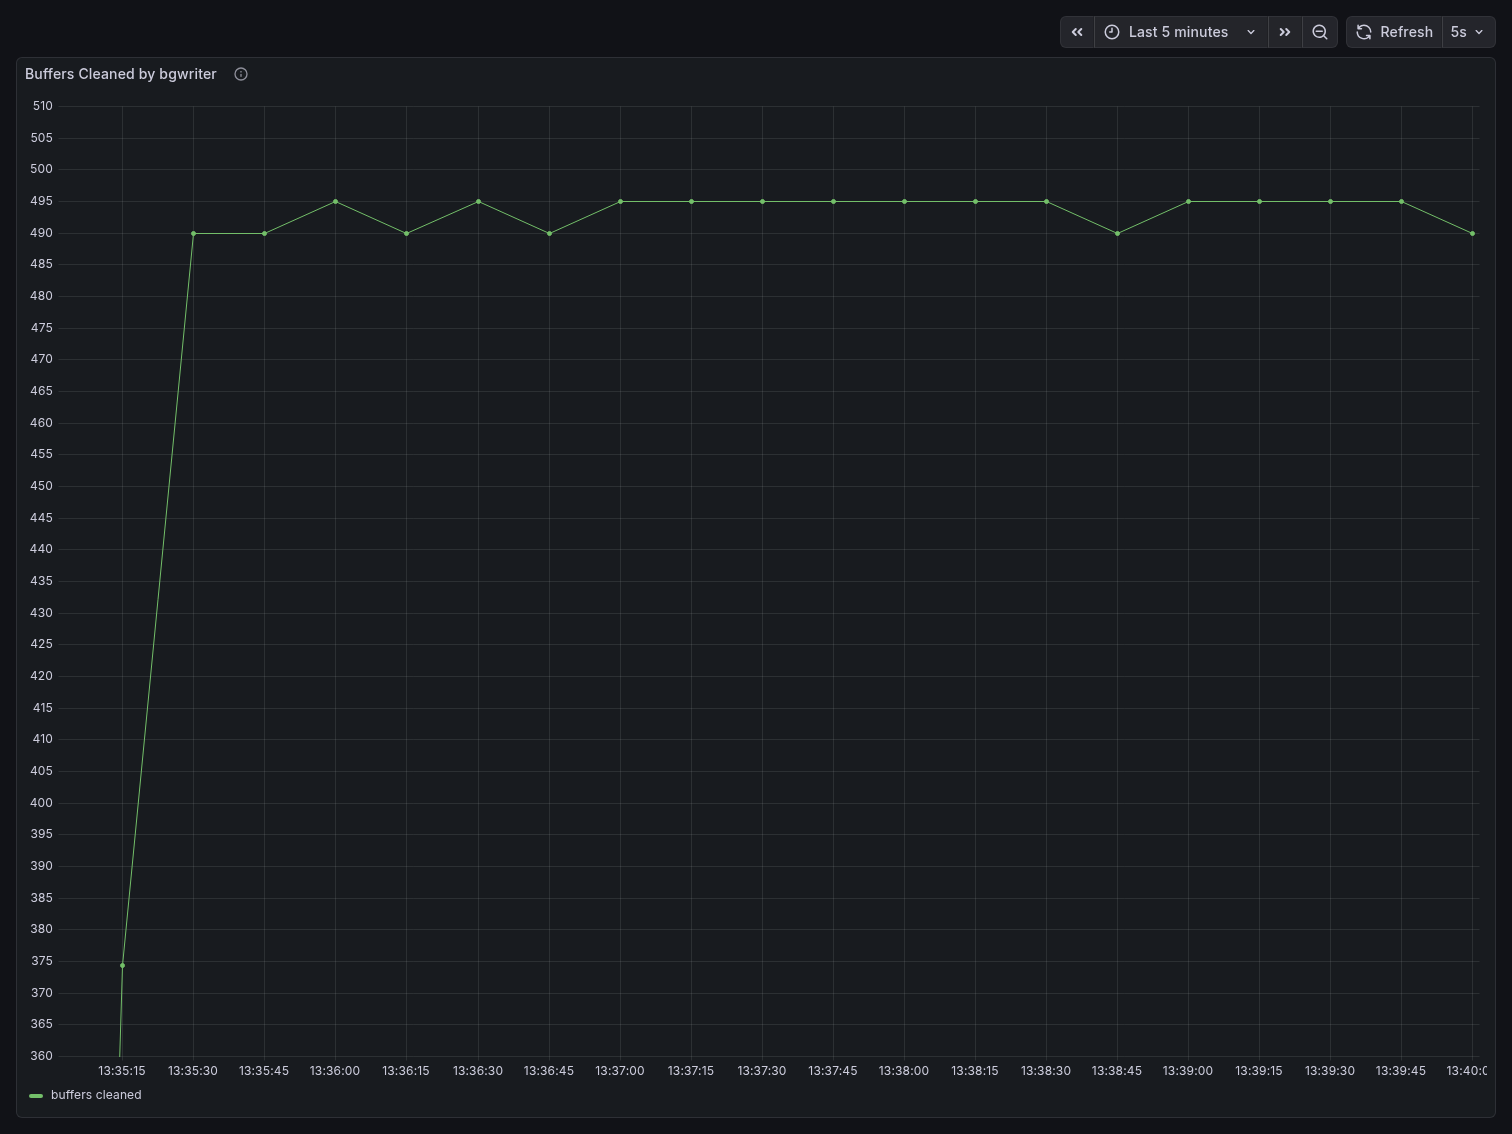
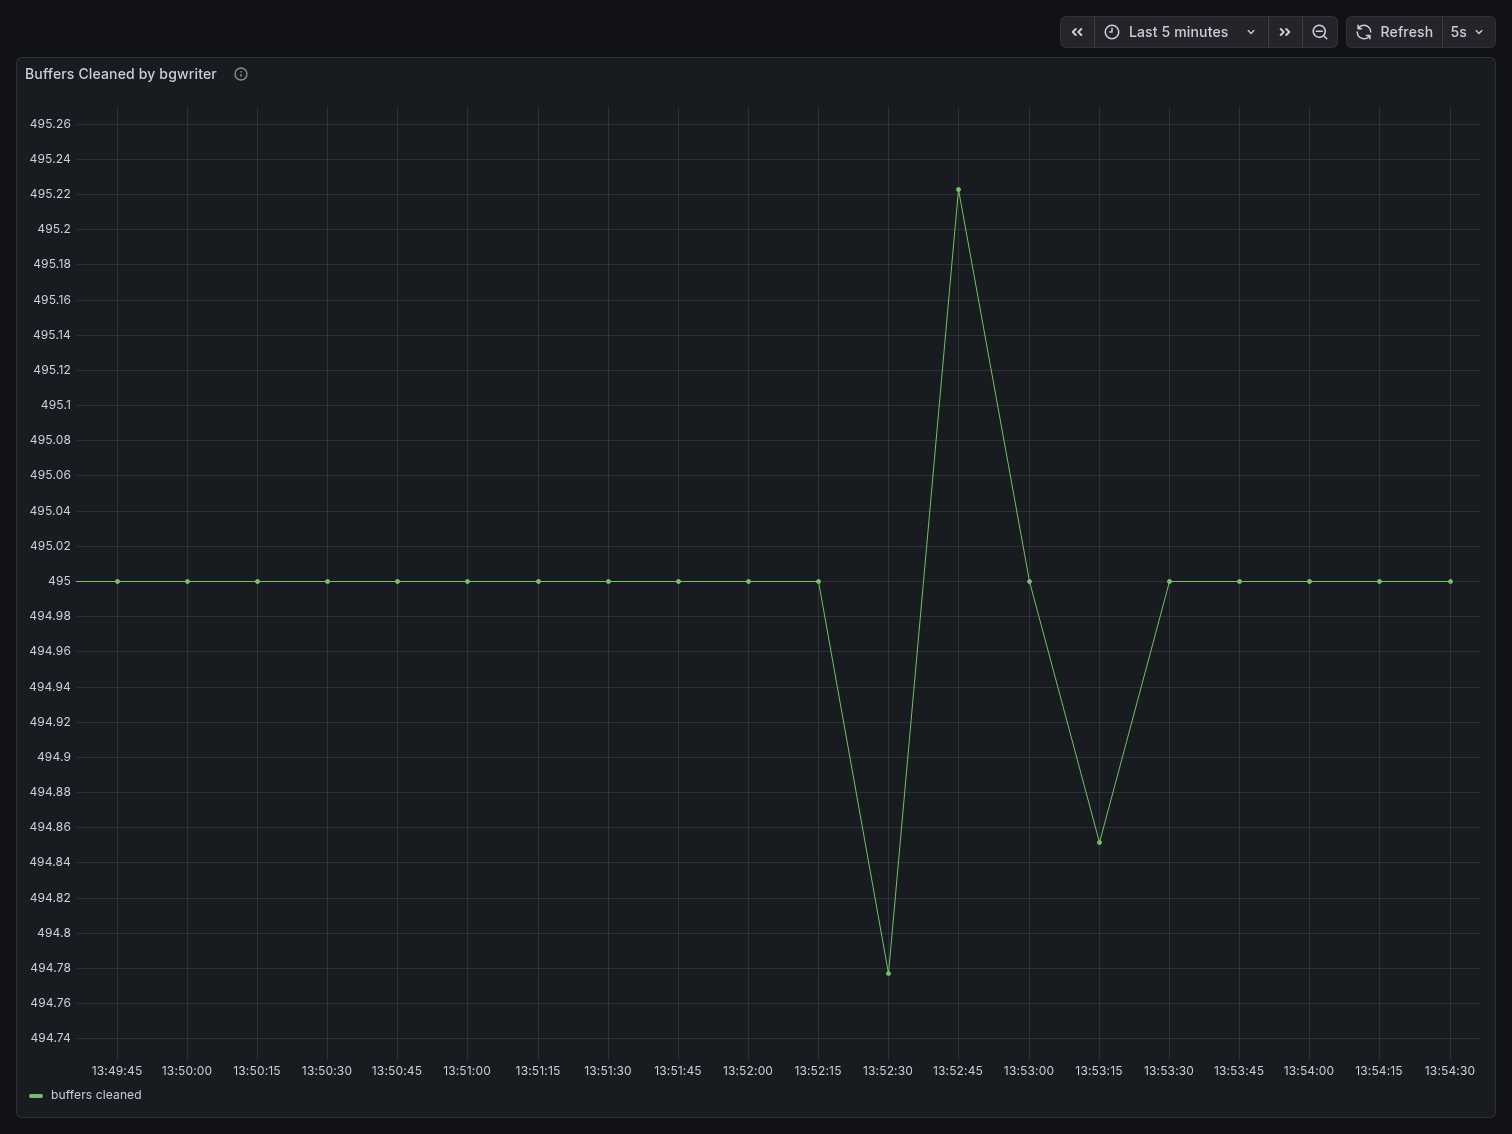
Buffers Cleaned by bgwriter was essentially flat at 495 throughout the entire run, with only a minor blip visible at 13:52:45. The Y-axis scale tells the story: the entire chart spans from 494.74 to 495.26 — a range of just 0.52 units. Compare this to the direct benchmark where buffers cleaned ranged from 360 to 495, a range of 135 units. The bgwriter had almost nothing to do.
Head-to-Head Comparison
| Metric | Direct Postgres (80 clients) | PgBouncer (200 clients) |
|---|---|---|
| Connections used | 83% | 28% |
| Postgres active connections (peak) | 34 | 11 |
| Postgres idle connections (peak) | 37 | 5 |
| TPS (peak) | ~6,040 | ~3,860 |
| TPS (sustained) | ~5,200–5,400 (degrading) | ~3,200–3,500 (stable) |
| Buffers allocated (sustained) | ~8.4s | ~4.4–4.8s |
| Buffers cleaned range | 360–495 | 494.74–495.26 |
| Client count | 80 | 200 |
Key takeaway
PgBouncer served 2.5x more clients while consuming 66% fewer Postgres connection slots and applying ~45% less memory pressure on the buffer pool. The bgwriter was virtually idle compared to the direct benchmark, and Postgres never saw more than 11 active connections regardless of the client load above.
The direct benchmark’s higher raw TPS reflects the fact that each of its 80 clients had a
dedicated server connection and never had to wait for pool availability. This is exactly the
trade-off PgBouncer introduces: you exchange some peak throughput for dramatically better
resource efficiency and headroom. In production systems where max_connections is a hard
ceiling and connection exhaustion causes outages, that trade-off is almost always worth making.
What the results show
The most important number is connection utilization: 83% with 80 direct clients vs 28% with 200 clients through PgBouncer. PgBouncer served 2.5x more clients while leaving Postgres with significantly more connection headroom. With direct connections, attempting 200 clients causes immediate connection refusal errors. With PgBouncer, 200 clients is well within operating range.
The throughput difference — direct Postgres peaked higher at ~6,040 TPS vs ~3,860 through
PgBouncer — reflects the cost of pool queuing. In transaction mode, a client that is between
transactions must wait for a server connection to become available. Increasing DEFAULT_POOL_SIZE
reduces this wait and brings throughput closer to the direct benchmark, while still keeping
Postgres connection utilization controlled. The pool size is a tuning parameter you can adjust
based on your workload.
Memory pressure was also reduced behind PgBouncer, because Postgres only allocates shared memory for 25 active server connections rather than 80. This is visible in both the buffer allocation rate and the bgwriter activity.
When to Use PgBouncer
PgBouncer is most useful in deployments where the number of application threads or processes
that hold Postgres connections is large relative to max_connections. This is common in
horizontally scaled applications, microservice architectures, or applications that use
connection-per-thread models.
It is less necessary in small deployments where the total connection count stays well below
max_connections, or in applications that already use an efficient connection pool within
the application itself.
Transaction mode is suitable for most standard OLTP workloads. If your application uses session
state features that do not work across transaction boundaries — SET variables, advisory locks,
LISTEN/NOTIFY, or protocol-level prepared statements — you will need to use session mode or
refactor those patterns.
Conclusion
PgBouncer reduces the number of real Postgres connections needed to serve a given number of application clients. The benchmark results show this concretely: 2.5x more clients, 66% fewer connection slots used, reduced memory pressure, and a near-idle bgwriter compared to the direct benchmark.
The setup described in this article — PgBouncer with postgres_exporter, pgbouncer_exporter,
Prometheus, and Grafana — gives you a way to observe these effects in your own environment and
tune pool settings based on actual measurements rather than guesswork.
The full project is available at https://github.com/tiagomelo/pgbouncer-demo.